E-ISSN:2583-2468

Research Article

Parameter Optimization

Applied Science and Engineering Journal for Advanced Research

2025 Volume 4 Number 4 July
Publisherwww.singhpublication.com

Advanced Process Parameter Optimization for Compressive Strength of FDM-Printed PETG Using GA-ANFIS

Sunil1*, Khatak P2, Sagar P3
DOI:10.5281/zenodo.17034327

1* Sunil, Department of Mechanical Engineering, Guru Jambheshwar University, Hisar, Haryana, India.

2 Pankaj Khatak, Department of Mechanical Engineering, Guru Jambheshwar University, Hisar, Haryana, India.

3 Prem Sagar, Department of Mechanical Engineering, Guru Jambheshwar University, Hisar, Haryana, India.

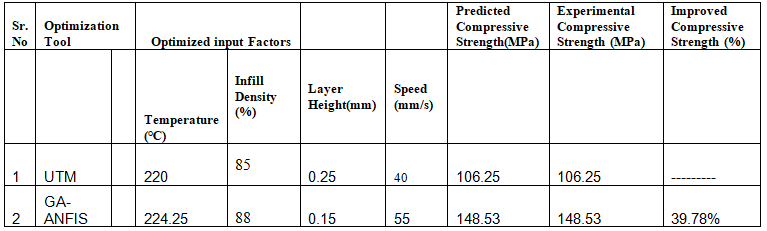
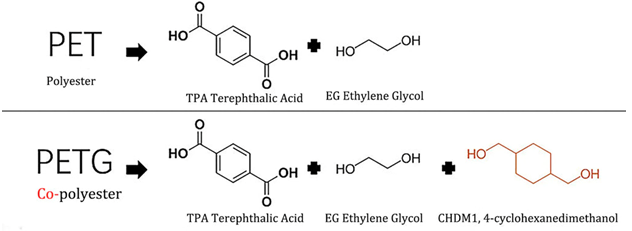
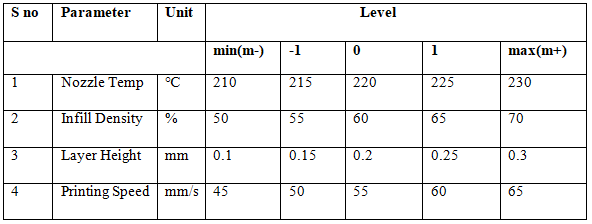
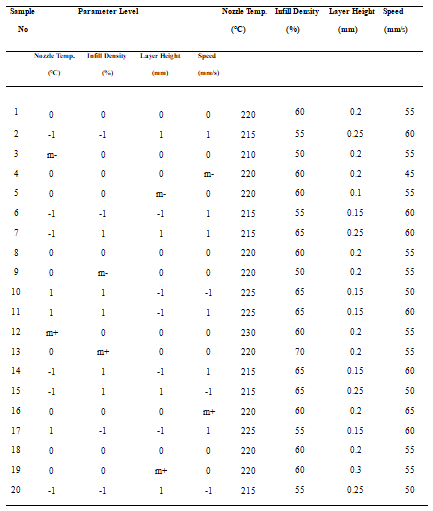
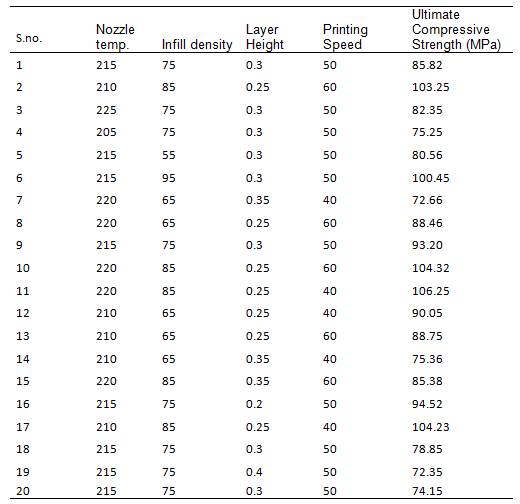
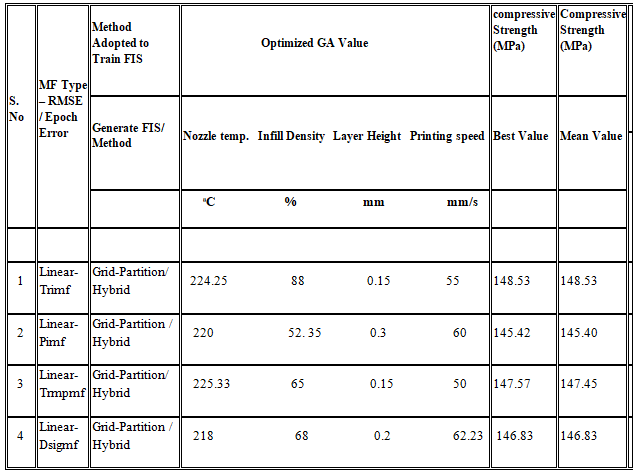
This study investigates the optimization of process parameters to enhance the compressive strength of polyethylene terephthalate glycol (PETG) parts manufactured using Fused Deposition Modeling (FDM). Compression test specimens were fabricated following ASTM D695 standards, with nozzle temperature, infill density, layer height, and printing speed selected as the key input variables. A three-level face-centered central composite design (FCCD) was employed to systematically evaluate their individual and interactive effects on ultimate compressive strength (UCS). Experimental testing revealed that higher infill density and reduced layer height significantly improved compressive performance, with UCS reaching 106.25 MPa under baseline conditions. To further optimize results, a hybrid Genetic Algorithm–Adaptive Neuro-Fuzzy Inference System (GA-ANFIS) framework was implemented, enabling accurate prediction and intelligent optimization of compressive strength. The optimized parameters—224.25 °C nozzle temperature, 88% infill density, 0.15 mm layer height, and 55 mm/s print speed—yielded a maximum UCS of 148.53 MPa, representing a 39.78% improvement over baseline results. The findings demonstrate that intelligent hybrid optimization provides a robust approach for tailoring FDM process parameters, thereby enhancing the structural reliability of PETG components for engineering applications.

Keywords: additive manufacturing, PETG, fused deposition modeling (FDM), compressive strength, GA-ANFIS, process optimization

Corresponding Author How to Cite this Article To Browse
Sunil, Department of Mechanical Engineering, Guru Jambheshwar University, Hisar, Haryana, India.
Email:
Sunil, Khatak P, Sagar P, Advanced Process Parameter Optimization for Compressive Strength of FDM-Printed PETG Using GA-ANFIS. Appl Sci Eng J Adv Res. 2025;4(4):42-52.
Available From
https://asejar.singhpublication.com/index.php/ojs/article/view/160

Manuscript Received Review Round 1 Review Round 2 Review Round 3 Accepted
2025-06-14 2025-07-03 2025-07-25
Conflict of Interest Funding Ethical Approval Plagiarism X-checker Note
None Nil Yes 3.12

© 2025 by Sunil, Khatak P, Sagar P and Published by Singh Publication. This is an Open Access article licensed under a Creative Commons Attribution 4.0 International License https://creativecommons.org/licenses/by/4.0/ unported [CC BY 4.0].

Download PDFBack To Article1. Introduction2. Materials
and methods
3. Result and
discussion
4. Conclusion
of the Study
References

1. Introduction

Fused Deposition Modeling (FDM) is a melt extrusion-based Additive Manufacturing technology for processing thermoplastics, composites, and biomaterials [1]. By depositing two-dimensional (2D) layers on a build platform, it can create flexible function parts with complicated geometry from a stereolithography (STL) file, which lowers assembly costs [2]. Because of its exceptional chemical resistance, transparency, high interlayer adhesion, low shrinkage, impact strength, and suitability for applications requiring elevated service temperatures or food safety, PETG has become a highly versatile thermoplastic within additive manufacturing, particularly in the fused deposition modeling (FDM) domain [3]. The compressive strength of PETG-based FDM parts is greatly influenced by printing conditions, as several investigations have demonstrated. According to research on carbon fiber-reinforced PETG, compressive performance is significantly impacted by both infill pattern and infilldensity; compressive strength increases significantly as infill density rises. For example, samples with a tri-hexagon design printed at 80% infill density had a noteworthy compressive strength of about 39.16 MPa, according to a different study, a triangular infill pattern offers greater modulus and compressive strength than alternative fill techniques, and mechanical characteristics are further enhanced by raising the infill density from 25% to 75% [4]. According to a study, infill density is the key lever for increasing compressive strength in PETG parts made using FDM in a cost-effective way. Layer height still affects overall value, but switching to 100% infill and 0.20 mm layer height achieves the best possible balance between strength and economy of production [5]. A linear elastic stress-strain behavior up to near-yield was found in a combined experimental and computational research. Interestingly, X and Y examples showed ductile, plastic deformation, but Z-direction specimens failed in a brittle, delamination-dominated way. Estimated compressive Young's moduli were around 1329.5 MPa for X, 1117.9 MPa for Y, and 1124.0 MPa for Z. Numerical simulations predicted displacements within 4% of experimental values, and an architecturally inspired "umbrella" structure was printed and tested to validate these findings. It sustained compressive loads (4,942 N in Z, 2,930 N in X–Y) significantly above the Spanish building-code requirement (~780 N) [6].

According to an experimental investigation, at a nozzle temperature of 420 °C, the maximum compression strength and strain of PEEK were determined to be 164.4 MPa and 73%, respectively. A layer height of 0.18 mm, a bed temperature of 130 °C, and an infill density of 100% were used throughout the test. The mechanical performance was much improved for the 10% carbon fiber-reinforced PEEK that was produced under the identical circumstances [7]. Response Surface Methodology (RSM)—to methodically investigate the effects of printing speed, nozzle temperature, and layer thickness on the tensile and flexural strength of PLA items that are FDM-printed. The ideal parameters, according to the RSM model, would provide peak tensile strength of 50.5479 MPa and flexural strength of 95.0163 MPa. These parameters were 0.2313 mm layer thickness, 208 °C nozzle temperature, and 55.5 mm/s printing speed [8]. RSM, FIS (Fuzzy Inference System), and ANN techniques are used to examine the combined effects of layer thickness, shell width, and raster width on dimensional accuracy. The tensile strength of ABS, PETG, and multi-material test specimens the latter created by alternating layers 50% ABS and 50% PETG using FDM is examined in this study in relation to material density, infill density, and extrusion temperature. An Artificial Neural Network (ANN) and a hybrid Genetic Algorithm–Artificial Neural Network (GA-ANN) model in MATLAB 16.0 were used to optimize 30 ASTM D638-(IV) standard samples that were created under various conditions. According to the findings, GA-ANN increased the tensile strength by as much as 4.54% [9]. A study revealed that a print speed of 50 mm/s, layer thickness of 0.1 mm, extrusion temperature of 230 °C, and raster width of 0.6 mm were the most effective ways to achieve the joint target of minimizing both dimensional deviation and surface roughness. ANFIS's prediction accuracy (mean error = 9.33%) was found to be superior to that of the RSM model (≈ 12.31%), according to comparative study. ANOVA also showed that raster width and layer thickness had the greatest influence on surface and dimensional quality, whereas print speed and temperature had more subtle but still significant effects [10]. ANN-GA and RSM to enhance the printed gels' physicochemical characteristics and digestibility (PSGG). With an R2 of 99.98% against 93.99%, respectively, ANN-GA performed better than RSM and determined respectively,


ANN-GA performed better than RSM and determined that extrusion speed was the most important factor. For both techniques, the ideal printing parameters were an extrusion speed of 24 mm/s, a nozzle diameter of 0.70 mm, and a nozzle height of 0.50 mm. Under these circumstances, PSGG showed better digestibility, rising from 46.93% in unprinted SGG to 51.52% in PSGG, as well as improved thermal characteristics, as seen by changed denaturation temperature and enthalpy [11].

In engineering applications in the consumer electronics, automotive, and aerospace sectors, compressive strength is crucial, especially for load-bearing parts like structural supports where material safety and dependability are crucial. Compression testing aids in component design, quality control, durability assurance, and material selection. The mechanical performance of FDM-printed PETG pieces is improved by increasing their compressive strength. Because of its clarity, resilience to impact, and compressive strength, FDM printed PETG may be used for enclosures, device housings, and lightweight supporting parts like orthopedic fixtures or prosthesis. This work therefore seeks to make two major contributions: (1) by enhancing process-parameter optimization for FDM-printed PETG in particular, and (2) by making it possible to fabricate stronger, more reliable parts, increasing their potential for use in engineering and manufacturing in the future.

2. Materials and methods

PETG is a material that is frequently used in FDM 3D printing. Because it validates PETG's biomaterial safety qualities and makes it possible to create strong parts because of its strong tensile, high ductility, flexibility, heat resistance, and chemical protection, it is suitable for prototypes, functional components, pharmaceutical, and clinical applications. The material properties of PETG shown by the Table 1., which is used in 3D printing, has qualities that are quite similar to ABS (great temperature resistance, durability), and it is just as simple to print as PLA. The chemical structure of PETG (polyethylene terephthalate glycol) is shown in Figure 1. The embossing process demonstrates that PETG is transparent and resistant to crystallization when exposed to high heat levels, and that its photostability in the presence of ultraviolet (UV) light decreases as the amount of CHDM in the polymer structure increases.

PETG plastic is a popular choice for packaging applications due to its transparency, impact strength, and chemical resistance. PETG's impact resistance, durability, and visual attractiveness make it suitable for the demanding automotive environment.).

asejar_160_01.PNG
Figure 1:
Chemical formulation of PETG [12]

Table 1: PETG Material properties
asejar_160_Table01.PNG

The program Design Expert13 was used to create the number of experimental runs, and a 2k factorial design was employed to cut down on the number of trails. The highest and lowest values of each input element were categorized as high (+1) and low (-1), respectively, to maintain a uniform range across all components. Furthermore, the axial points (high and low) and zero level (center points) of each factor were considered. Furthermore, the axial points (high and low) and zero level (center points) of each factor were considered. A three-level face-centered central composite design (FCCD) was then used to statistically evaluate the primary and interaction effects of the four process parameters on compressive strength. The Table 2. Describe the FDM input Printing Parameters with Defined Ranges.

Table 2: FDM Printing Parameters with Defined Ranges
asejar_160_Table02.PNG


Test specimens were designed using AutoCAD which first saved the specimen design file with a .prt extension before exporting it into a stereolithographic file, or. STL format. The generated .STL file was then uploaded to the approaching software of the MAKERBOT MATHODX printer to set the tool path and all process parameters in line with the experimental design matrix for component manufacture.

2.1 Test Specimen printing as per design of experiment (DOE)

Following ASTM standard guidelines, the 20 compression test specimens were created using a MakerBot Method X 3D printer which are visualize by Figure 1(b) and subsequently put through a universal testing equipment to determine their compression resistance. The advanced MakerBot Method X printer, shown in Figure 1(a), was used in the fabrication process. To improve the test samples' resistance to compression, the main input parameters for fused deposition modeling (FDM), including nozzle temperature, infill density, layer height, and print speed, are being changed.

Printing process start withthe MakerBot Method X is correctly configured and calibrated first. By Insert the PETG filament into the filament section of the printer. The Smart Spool technology of the Method X will automatically identify the material and modify the settings as necessary. To select the printing parameter, use the MakerBot Print software to start the printing process after configuring the print parameters. The extruder and build plate will be automatically heated to the specified temperatures by Method X. Using the printer's touchscreen interface, which offers real-time updates and alarms, keep an eye on the print's development. Let the item cool when printing is finished, then take it off the construction plate. If required, remove any extra material or support structures using the proper instruments. Lightly sand the printed object's surface for a smoother finish.

The experimental design summarized in Table 3 was structured to systematically investigate the effects of key process parameters on the properties of 3D-printed PETG specimens.

The table presents a series of experimental runs based on a design of experiments (DOE) approach, where the primary variables—nozzle temperature, infill density, layer height, and print speed—were each varied across predetermined levels, including coded values for statistical analysis (such as -1, 0, 1, and center points m+, m−). For each experimental run, specific parameter combinations were assigned, with nozzle temperature ranging from 210°C to 230°C, infill density from 50% to 70%, layer height from 0.1 mm to 0.3 mm, and print speed from 45 to 65 mm/s. This approach allows for the isolation and assessment of both individual and interactive effects of process parameters on the printed part’s quality, mechanical performance, and consistency. Repetition of mid-level and center-point experiments further increases the reliability and statistical power of the analysis, making this DOE a robust foundation for empirical optimization of PETG 3D printing processing conditions.

asejar_160_011(a).PNG
Figure 1(a):
MakerBot Method X 3D Printer

asejar_160_011(b).PNG
Figure 1(b):
ASTM Standard Compression 3D printed Specimen


Table 3: Design of experiment (DOE) in accordance with Research plan
asejar_160_Table03.PNG

2.2 Compression testing and determination of Ultimate compressive strength (UCS)

A compression test was conducted on a PETG (polyethylene terephthalate glycol) specimens and using a universal testing machine set to a speed of 5 mm/min and a displacement increment of 0.1 mm. The tested sample had a length of 15 mm and a cross-sectional area of 150 mm². The system was calibrated with a load cell capable of measuring up to 20,042 N, and the test was conducted in peak mode with defined high and low load limits (19,000 N and 100 N, respectively). The sample’s mechanical response and ultimate capacity acceptably met the specified criteria, and the test status was marked as “Accepted.”

These results provide valuable insight into the compressive behavior of PETG materials produced under defined conditions, supporting data-driven material characterization.

2.3 Genetic Algorithm–ANFIS Framework for Training and Optimization

The GA-ANFIS hybrid technique turned out to be an effective statistical data management methodology. In this instance, the crucial task of data training was assumed by the Adaptive Neuro-Fuzzy Inference System (ANFIS),

which was then optimized using the Genetic Algorithm (GA). ANFIS, which blends fuzzy systems' inference mechanisms with neural networks' learning capabilities, showed remarkable flexibility in modifying its settings to get the required results. To improve process parameters and improve or maximize the UCS (Ultimate compressive strength) of PETG parts, a hybrid modeling technique known as GA-ANFIS was used in this work. When modeling nonlinear systems, when conventional methods might not be enough, ANFIS is very helpful. It uses five different steps to analyze information: transforming input values into fuzzy sets, applying fuzzy rules, assessing the strength of the rules, combining outputs to get a final, precise numerical value. The ANFIS model was trained using experimental data, considering four key FDM process parameters—nozzle temperature, layer height, infill density, and print speed—as inputs. These parameters play a crucial role in determining the compressive strength of the printed PETG components. . The fuzzy controller's main objective was to learn and maximize performance under various circumstances. The membership functions (MFs) were designed during the training phase using the batch learning ANFIS approach, and the backpropagation algorithm was used to refine the Fuzzy Inference System (FIS) file. By reducing the epoch error value, the training model's performance was verified, showing that it was successfully learning and reaching the intended results. Following successful tuning, the FIS file was combined with the GA to yield optimal outcomes.

2.4 Experimental Data Training and Performance Evaluation Using GA-ANFIS

The Adaptive Neuro-Fuzzy Inference System (ANFIS) is a hybrid model that combines the learning capability of neural networks with the rule-based reasoning of fuzzy logic. In this study, a dataset of 20 samples (20×5 matrix) was imported from MATLAB, consisting of four input parameters—nozzle temperature, infill density, printing speed, layer height and UCS as the output. A Sugeno-type FIS was generated using grid partitioning, where each input was represented by three membership functions, resulting in 27 fuzzy rules. Training was conducted with hybrid optimization (least squares and backpropagation) over three epochs. To assess the effect of membership function choice, different FIS models were tested using the 11 built-in MF types available in ANFIS, along with options for custom MFs.


Model performance was evaluated for custom MFs. Model performance was evaluated in terms of accuracy and error metrics, highlighting the impact of MF selection on UCS prediction in the additive manufacturing process.

3. Result and discussion

3.1 Compression Testing (UCS) Result Analysis

An extensive set of experiments (as per Table 4), was conducted using the FCCCD approach, the compressive testing specimen were fabricated using the ASTM standard of D695 utilizing 20 different combinations of input parameters such as Nozzle temperature, Infill density, Layer height and printing speed. The Ultimate compressive strength was determined across each sample by UTM testing, the sample which was 3d printed with four different input parameters.

Table 4: Compressive strength analysis at input parameters combinations

asejar_160_Table04.PNG

From the above data, it is evident that variations in the input parameters significantly impact the compressive strength of the samples. For example, higher nozzle temperatures around 220°C combined with higher infill densities (above 85%) and moderate printing speeds tend to yield the highest UCS values (e.g., Exp. Nos. 10 and 11 with UCS exceeding 104 MPa). Conversely, lower infill densities and/or extreme layer heights generally produce lower compressive strengths.

The findings align with existing literature indicating that higher infill density improves structural integrity by increasing material volume, while optimal nozzle temperature ensures proper melting and fusion of the layers. Additionally, layer height influences the bonding quality between layers, impacting the overall load-bearing capacity.

From the above data, it is evident that variations in the input parameters significantly impact the compressive strength of the samples. For example, higher nozzle temperatures around 220°C combined with higher infill densities (above 85%) and moderate printing speeds tend to yield the highest UCS values (e.g., Exp. Nos. 10 and 11 with UCS exceeding 104 MPa). Conversely, lower infill densities and/or extreme layer heights generally produce lower compressive strengths. The findings align with existing literature indicating that higher infill density improves structural integrity by increasing material volume, while optimal nozzle temperature ensures proper melting and fusion of the layers. Additionally, layer height influences the bonding quality between layers, impacting the overall load-bearing capacity.

3.2 Developing optimization model through GA-ANFIS using experimental data

The Neuro-Fuzzy Designer interface, as shown in Figure 2(a), offers a comprehensive graphical environment for the development and training of ANFIS models in MATLAB. Users can import datasets for training, testing, and validation from external files or the MATLAB workspace. This flexibility facilitates the integration of experimental data and supports robust model evaluation. In this study input (20×5 matrix) named ip is added from workspace. The tool allows the generation of a fuzzy inference system (FIS) using methods such as grid partitioning or subtractive clustering, based on the structure and characteristics of the input data. Study used grid portioning.

The training panel enables the specification of important parameters, including optimization method (such as hybrid, which combines least squares and backpropagation), error tolerance, and the number of training epochs. These settings determine the efficiency and accuracy of model learning. The tool provides options to test the trained FIS against training, testing, or checking data and visualize the results.


A plotting area is available for graphical evaluation of model performance. The interface displays a summary of the current ANFIS structure, including the number of inputs, outputs, and the number of membership functions (MFs) assigned to each input.

asejar_160_02(a).PNG
Figure 2(a):
ANFIS Training Model

Figure 2(b) displays a scatter plot titled "Training Data (ooo)", representing the distribution of output values corresponding to different data set indices in the training set. Each point in the plot corresponds to a unique sample, with the x-axis ("data set index") denoting the index of each data point in the training set, and the y-axis ("Output") specifying the measured or computed outcome for that data point. The output values vary across the dataset, spanning a range from approximately 70 to just above 110. This spread indicates inherent variability in the target measurements or predictions the model is expected to learn. The transparent background for the plotting area against the gray surrounding highlights the data points clearly, with open blue circles used for representation to avoid overlap and aid in visibility even with closely spaced points.

No obvious linear or non-linear pattern is visually apparent in the scatter of outputs, suggesting that the relationship between the data set index and the output is likely non-sequential or influenced by features not represented in this index plot. This characteristic underlines the importance of considering additional explanatory variables and employing robust modeling techniques to uncover the underlying patterns in the data.

Such an initial visualization provides valuable insight into the nature of the training data, helps identify possible anomalies or outliers, and assists in guiding the next steps of data preprocessing.

asejar_160_02(b).PNG
Figure 2(b):
ANFIS Training data visualization

Figure 2(c) presents the training error progression across the first three epochs of the model training phase. Each point on the scatter plot represents the measured training error at the end of the corresponding epoch. The results demonstrate that the training error remains consistently low and stable, with only slight variation across the epochs observed. The minimal fluctuation in training error and the maintenance of a low error magnitude are clear indicators of effective and well-converged training. This steady trend suggests that the chosen training strategy—encompassing model architecture, data preprocessing, and hyperparameter settings—has led to rapid learning and early stabilization. The model effectively captures the underlying patterns of the training data without signs of overfitting or underfitting.

Such consistently low error values so early in the training process reflect both a suitable model design and high representational quality of the input features. This positive outcome validates the training configuration and demonstrates the model’s reliable performance, while figure 3 shows implication framework for sugeno-fuzzy.

asejar_160_02(c).PNG
Figure 2(c):
ANFIS Training error progression


asejar_160_03(a).PNG
Figure 3(a):
Structure of the ANFIS Model

asejar_160_03(b).PNG
Figure 3(b):
Fuzzy Inference System Rule Viewer, 3(c): 3D Surface Plot of Fuzzy Inference System

The table (Table 5) compares results from the ANFIS (Adaptive Neuro-Fuzzy Inference System) with GA (Genetic Algorithm) optimization for predicting and optimizing compressive strength in a 3D printing context. The highest optimized compressive strength of 148.53 MPa was achieved using a Linear-Trimf membership function with a nozzle temperature of 215.25°C, infill density of 65%, a layer height of 0.25 mm, and a printing speed of 53.25 mm/s. Other configurations yielded slightly lower compressive strengths, ranging mostly between 145.4 and 147.5 MPa. The results show how different membership functions and optimized process parameters via GA affect the resulting compressive strength predictions of the ANFIS model.

This comparative analysis demonstrates the effectiveness of combining ANFIS with GA optimization to tune 3D printing parameters, leading to improved material compressive strength predictions and potentially optimized printing performance.

Table 5: Comparing ANFIS and GA-Optimized results: a comparative analysis
asejar_160_Table05.PNG

The figure 2(d) presents a line graph illustrating the evolution of compressive strength across generations in an optimization process. The x-axis represents the "Generation," while the y-axis shows "Compressive Strength." Two lines are plotted: the green line indicates the "Best Strength" per generation, and the black line shows the "Mean Strength." Both metrics rapidly increase in early generations and stabilize near a compressive strength of 148.53. The chart’s title highlights the final best and mean strengths achieved, both valued at 148.53. The results suggest successful convergence of the optimization toward the maximum compressive strength.

asejar_160_03(c).PNG
Figure 3(c):
Assimilation results of GA-ANFIS for compressive strength optimization.


3.3 Validation study of Compressive Strength Predictions

Table 6 presents a comparative analysis of the output results obtained using different optimization tools for predicting and improving the compressive strength of the fabricated samples. The table compares the performance of aUniversal Testing Machine (UTM) with that of ahybrid Genetic Algorithm–Adaptive Neuro-Fuzzy Inference System (GA-ANFIS) optimization approach. From the table, it is observed that the UTM-based experimental analysis, carried out at a process temperature of220 ℃, an infill density of85%, a layer height of0.25 mm, and a printing speed of40 mm/s, resulted in a measured compressive strength of106.25 MPa. This value represents the baseline strength without the application of any intelligent optimization techniques.

In contrast, the GA-ANFIS approach explored different parametric settings, suggesting an optimized configuration of 224.25℃ temperature, 88% infill density, 0.15 mm layer height, and a higher printing speed of 55 mm/s. These optimized parameters led to apredicted and experimentally confirmed compressive strength of 148.53 MPa, which represents a substantial improvement over the UTM baseline results. Specifically, an improvement of 39.78% in compressive strength is achieved through the intelligent optimization procedure.

Table 6: Comparative output result obtained by different optimization tool
asejar_160_Table06.PNG

4. Conclusion of the Study

The present study demonstrates the crucial role of process parameter optimization in enhancing the compressive strength of additively manufactured specimens. Baseline experimental testing using a Universal Testing Machine (UTM) yielded a compressive strength of106.25 MPaunder conventional process settings. However, optimization using the hybridGenetic Algorithm–Adaptive Neuro-Fuzzy Inference System (GA-ANFIS)

strategy resulted in a significantly improved strength of 148.53 MPa, corresponding to a39.78% enhancement compared to the UTM baseline. Among the studied input factors,layer height and infill density exhibited the most pronounced influence on compressive strength. A reduction in layer height from 0.25 mm to 0.15 mm contributed to better interlayer bonding and reduced void formation, directly improving load-bearing capacity. Similarly, increasing the infill density from 85% to 88% increased the solid content within the structure, thereby enhancing its strength. Although processing temperature and printing speed also affected performance, their impact was secondary in comparison to layer height and infill density. Overall, the results establish that process parameters cannot be optimized independently; rather, their combined synergistic effect dictates the final mechanical performance. The GA-ANFIS model efficiently captured these complex nonlinear interactions, thereby providing an accurate predictive tool for optimization.

This study conclusively highlights that intelligent hybrid optimization approaches can significantly improve structural performance in additive manufacturing while minimizing experimental trials. Future research can further extend these methodologies to optimize other critical properties

Data Availability Statements

All data generated or analyzed during this study are provided in the manuscript.

References

1. B. Mallikarjuna, Pachipulusu Bhargav, Shivashankar Hiremath, K. G. Jayachristiyan, & N. Jayanth. (2023). A review on the melt extrusion-based fused deposition modeling (FDM): background, materials, process parameters and military applications. doi:10.1007/s12008-023-01354-0.

2. Dey, A., & Yodo, N. (2019). A systematic survey of FDM process parameter optimization and their influence on part characteristics. Journal of Manufacturing and Materials Processing, 3(3), 64. https://doi.org/10.3390/jmmp3030064

3. Valvez, S., Silva, A. P., & Reis, P. N. B. (2022). Compressive behaviour of 3D-printed PETG composites. Aerospace, 9(3). https://doi.org/10.3390/aerospace9030124


4. Kumaresan, R., Samykano, M., Kadirgama, K., Pandey, A. K., & Rahman, M. M. (2023). Effects of printing parameters on the mechanical characteristics and mathematical modeling of FDM-printed PETG. International Journal of Advanced Manufacturing Technology, 128, 3471–3489. https://doi.org/10.1007/s00170-023-12155-w

5. Iacob, D. V., Zisopol, D. G., & Minescu, M. (2024). Technical-economical study on the optimization of FDM parameters for the manufacture of PETG and ASA parts. Polymers, 16(16), 2260. https://doi.org/10.3390/polym16162260

6. Mercado-Colmenero, J. M., La Rubia, M. D., Mata-García, E., Rodriguez-Santiago, M., & Martin-Doñate, C. (2020). Experimental and numerical analysis for the mechanical characterization of PETG polymers manufactured with FDM technology under pure uniaxial compression stress states for architectural applications. Polymers, 12(10), Article 2202. https://doi.org/10.3390/polym12102202

7. Adarsh, S. H., & Nagamadhu, M. (2025). Effect of printing parameters on mechanical properties and warpage of 3D-printed PEEK/CF-PEEK composites using multi-objective optimization technique. Journal of Composites Science, 9(5), 208. https://doi.org/10.3390/jcs9050208

8. Thakur, A., Vates, U. K., & Mishra, S. (2023, May). Prediction of mechanical properties of FDM printed PLA parts using response surface methodology (Preprint). https://doi.org/10.21203/rs.3.rs-2893592/v1

9. Yadav, D., Chhabra, D., Garg, R. K., Ahlawat, A., & Phogat, A. (2020). Optimization of FDM 3D printing process parameters for multi-material using artificial neural network. Materials Today: Proceedings, 21, 1583–1591. https://doi.org/10.1016/j.matpr.2019.11.225

10. Mishra, P., Sood, S., Bharadwaj, V., & Aggarwal, A. (2023). Parametric modeling and optimization of dimensional error and surface roughness of fused deposition modeling printed polyethylene terephthalate glycol parts. Polymers, 15(3), 546. https://doi.org/10.3390/polym15030546

11. Carvajal-Mena, N., Tabilo-Munizaga, G., Saldaña, M. D. A., Pérez-Won, M., Herrera-Lavados, C., Lemus-Mondaca, R., & Moreno-Osorio, L. (2023). Three-dimensional printing parameter optimization for salmon gelatin gels using artificial neural networks and response surface methodology:

Influence on physicochemical and digestibility properties. Gels, 9(9), 766. https://doi.org/10.3390/gels9090766

12. https://eibos3d.com/blogs/ideas/what-is-petg

13. Sagar P. (2024). Enrichment in fracture ductility tribological characteristics of magnesium-based nanocomposites fabricated via multi-pass friction stir processing and study of significant parameters. J Mater Eng Perform. https://doi.org/10.1007/s11665-024-09652-8

14. Bingham D. (n.d.). Handbook of design and analysis of experiments.

15. Patpatiya P, Shastri A, Sharma S, Chaudhary K, & Bhatnagar V. (2022). ANN-predictive modeling and GA-optimization for minimizing dimensional tolerance in polyjet additive manufacturing. CIRP J Manuf Sci Technol, 38, 320-339.

16. Allahkarami E, & Nuri OS. (2017). Improving estimation accuracy of metallurgical performance of industrial flotation process by using hybrid genetic algorithm – artificial neural network (GA-ANN). Physicochem Probl Min Process, 53, 366–378.

17. Nabavi-Kivi A, Ayatollahi MR, Rezaeian P, & Razavi N. (2022). Investigating the effect of printing speed and mode mixity on the fracture behavior of FDM-ABS specimens. Theor Appl Fract Mech, 118, 103223.

18. Agnelli J, Pagano C, Fassi I, Treccani L, Bignotti F, & Baldi F. (2024). Mechanical behaviour of ductile polymer cellular model structures manufactured by FDM. Mech Mater, 190, 104882

19. P. Sagar, & A. Handa. (2023). Enhanced strength ductility and wear resistance in a friction stir processing engineered AZ31B/TiC magnesium-based nanocomposites. Can. Metall. Q., 1–19, https://doi.org/10.1080/00084433.2023.2289800

20. P. Sagar, & A. Handa. (2020). A comprehensive review of recent progress in fabrication of magnesium base composites by friction stir processing technique—A review. AIMS Mater. Sci., 7, 684–704, https://doi.org/10.3934/matersci.2020.5.684

21. S.K. Gupta, M.K. Mahto, A.R. Raja, M. Vashista, & M.Z.K. Yusufzai. Effect of friction stir processing on the mechanical properties of gas metal arc welded AISI 409 L stainless steel plate. Mater. Today Commun, 41, 111075. https://doi.org/10.1016/j.mtcomm.2024.111075


22. X. Han, H. Li, W. He, G. Wang, X. Zhang, X. Wang, S. Volodymyr, & O. Shcheretskyi. (2024). Study on the microstructure and mechanical properties of hot rolled nano-ZrB2/ AA6016 aluminum matrix composites by friction stir processing. Mater. Today Commun, 40, 109815. https://doi.org/10.1016/j.mtcomm.2024.109815

23. R. Madadi, S.M.H. Pishbin, S.M. Fatemi, A. Zarei, & J.-H. Cho. (2024). Friction stir processing of pure titanium/nanodiamonds nanocomposites: microstructure, tribological and corrosion properties. Mater. Today Commun., 40, 109975. https://doi.org/10.1016/j.mtcomm.2024.109975

Disclaimer / Publisher's Note: The statements, opinions and data contained in all publications are solely those of the individual author(s) and contributor(s) and not of Journals and/or the editor(s). Journals and/or the editor(s) disclaim responsibility for any injury to people or property resulting from any ideas, methods, instructions or products referred to in the content.