E-ISSN:2583-2468

Research Article

Tribological Properties

Applied Science and Engineering Journal for Advanced Research

2025 Volume 4 Number 3 May
Publisherwww.singhpublication.com

Improving Wear Resistance of Epoxy Composites via Ceramic Nanoparticle Reinforcements by using Taguchi Technique

Quraishi IM1*, Chikalthankar SB2
DOI:10.5281/zenodo.15575896

1* Imran M Quraishi, Research Scholar, Department of Mechanical Engineering, Government College of Engineering, Aurangabad (CSN), Maharashtra, India.

2 Sanjay B Chikalthankar, Associate Professor, Department of Mechanical Engineering, Government College of Engineering, Aurangabad (CSN), Maharashtra, India.

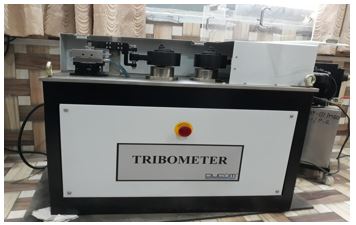
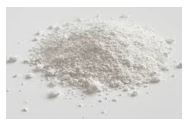
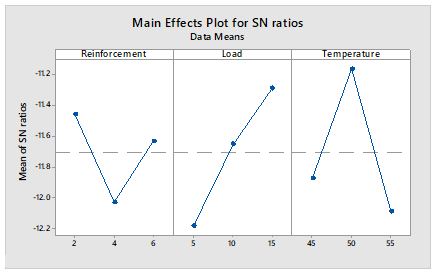
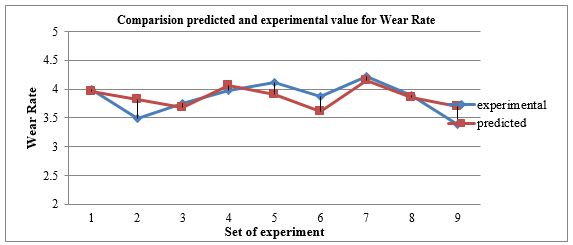
In this study, the weight percentages of various composites are added to epoxy resin coating material with a fixed amount of ceramic particles in order to improve the coating's mechanical and tribological qualities. Prepared were test specimens of pure epoxy resins with varying reinforcement weight percentages (4%, 6%, and 8%). The configuration of a tribometer is used to examine the material's wear properties by conducting various tests on a polymer matrix composite. The results show that adding TiO2 (titanium dioxide) and creamic Al2O3 (aluminum oxide) reinforcement material significantly improves the mechanical and tribological characteristics of the newly developed epoxy paint composite. On a tribometer with variable load and temperature, the wear resistance of a specimen was examined. According to the data, both reinforcements in epoxy resins result in a lower wear rate than pure epoxy. An analysis of variance, also known as an ANOVA, was carried out in order to ascertain the relevance of the operating parameters to the performance qualities that were being taken into account. Further experimentation has been conducted to validate the performance of optimal parameters. Finally, the confirmation test to compare the projected value of the wear rate to the experimental value has been conducted.

Keywords: tribometer, anova, tio2, al2o3, tribological properties

Corresponding Author How to Cite this Article To Browse
Imran M Quraishi, Research Scholar, Department of Mechanical Engineering, Government College of Engineering, Aurangabad (CSN), Maharashtra, India.
Email:
Quraishi IM, Chikalthankar SB, Improving Wear Resistance of Epoxy Composites via Ceramic Nanoparticle Reinforcements by using Taguchi Technique. Appl Sci Eng J Adv Res. 2025;4(3):18-25.
Available From
https://asejar.singhpublication.com/index.php/ojs/article/view/147

Manuscript Received Review Round 1 Review Round 2 Review Round 3 Accepted
2025-04-02 2025-04-22 2025-05-12
Conflict of Interest Funding Ethical Approval Plagiarism X-checker Note
None Nil Yes 4.73

© 2025 by Quraishi IM, Chikalthankar SB and Published by Singh Publication. This is an Open Access article licensed under a Creative Commons Attribution 4.0 International License https://creativecommons.org/licenses/by/4.0/ unported [CC BY 4.0].

Download PDFBack To Article1. Introduction2. Material
and Methods
3. Results
and Discussion
4. ConclusionsReferences

1. Introduction

Powder coating techniques are utilised in the majority of production-related fields to create protective coatings. Powder can be created to offer a protective surface and durability, as well as to obtain increased hardness, chemical resistance, and a surface that retains its gloss. Automation helps powder coat hot and cold substrates in corrosive and high-pressure environments. Powder coating protects under-hood car components from severe temperatures and pressures. Powder coating polishes the wheel, mirror frame, oil filter, and coil spring better. Powder coatings are primers and topcoats, but they are also being used as powerful topcoats. Scratch-resistant powder coatings that are framed in a particular way are used by some appliance manufacturers in place of the labor- and resource-intensive procedure of putting a porcelain surface on the tops of washing machines. Currently, powder coating is used on components of home appliances such as range dryer drums and housings, as well as the interior of microwave ovens and their frames.

2. Material and Methods

A. Methodology of Experiment

There are many ways to improve the way a product, process, or operation is made. There are a variety of approaches one can take in order to achieve the best possible rate of wear. It is sometimes required to combine a large number of approaches in order to obtain statistically significant results can improve conclusions and suggestions. DOE is a very good way to find out what the effects of parameters are because it changes several parameters at once. When more parameters are investigated, it becomes necessary to create an increasing number of novel combinations. As the DOE is unable to manage each factor independently, it instead relies on numerical data.

It is a very accurate way to figure out what happens when change the value of each parameter. It was found that reinforcement, load, and temperature had the most effect on the wear rate. Using observations, Finding the optimal values for the process parameters required the optimization method. To find optimal range of parameter for the optimization research, an OVAT analysis was done.

The orthogonal array (OA) design has been chosen for the Taguchi method L9. The standard way to write OA is:

OA = Ln(Xm),

Where n is the how many experiment, X the number of level, and m the number of parameters being examined.

B. Experimental Machine Selection

The tribometer that was used in this research is broken down into its component parts in Table 1. The Government Engineering College in Aurangabad, which is located in Maharashtra, India, is where all of the tests were carried out.

asejar_147_01.JPG
Figure 1.
Tribometer Setup

Table 1: Tribometer Specifications.

Make ModelDucom Ltd., Banglore, India
Specification (Upper)Pin(dia. 1): 4, 6, 8, and 10 millimetres (15 millimetres).
rectangular pin (lbh)-4, 6, and 15
Pin Square (lbh): 4x4mm, 6x6mm, and 8x8mm.
Ball—10 mm
Lower StandardBlock of Rectangular Shape (lbh): 40x40, 5x30, 5x20 mm
Lower Standard (material)EN 31 Steel
Lower Standard (Hardness)lower standard a 60 HRC hardness
Stroke Length RangeThe stroke length range is fixed at 10-20-30.
Load RangeThe load range is from 5 to 100 N. (In the step of 5N)
Temperature RangeAmbient temperature 200 to 200 degrees Celsius, 200 to 200 degrees Celsius (For Both Lubrication).
Frequency/Speed Range1-20Hz Frequency (Speed) Range (1200rpm)
Least count: 1 rpm, Sensor, and Proximity Sensor
Frictional Force0.1-100N Frictional Force
Sensor: Piezo Sensor; Lowest Count: 0.1N
Range of Wear Measurement2 mm, lowest count 1 micron

Water-SupplyWater flow rate: 2–5 lpm There is an internal connection provision built in. while doing heating, connect the outside faucet to the water supply.
Power230V* 1 Φ*50Hz, 8A(For Tester)

C. Selection of Material

One of the most important things is how choose the materials for experimental work. There have been a lot of studies on how to improve powder coating by improving process parameters. TiO2 nanoparticles are mixed with the epoxy coating to make it harder to wear down. In order to improve the epoxy resins' mechanical qualities, this procedure is carried out. Epoxy powder is known for how well it sticks to things and how long it lasts. This is why it is mostly used in the oil industry and in refrigerators because of how well it transfers heat. It is also used in the auto industry. Nanoparticles are mixed with the epoxy coating to make it more resistant to wear. This also helps improve the mechanical properties of the coating. There have been studies on how to mix nanoparticles evenly into epoxy composite coatings, but there haven't been many studies on how to mix nanoparticles into epoxy powder.

asejar_147_02.JPG
Figure 2:
TiO2 nanoparticles

In this study, the epoxy powder coating is made with silica nanoparticles as fillers. Nano research lab matrics technologies solutions in Tamil Nadu, India, gave them titanium dioxide nanoparticles.

3. Results and Discussion

Most of the time, S/N ratio or main effect plots of means to figure out how temperature, load, and reinforcement affect the wear rate of the output. Minitab 19 statistical software and Design expert software have been used for this purpose. Models have been made of the rate of wear. ANOVA and a linear regression model were used to determine how each parameter impacts wear rate.

A. Calculation of SN ratio

SN ration is used to normaliszed the experimental data in specific range calculated and the response for SN ratio smaller is better selected.

Given below is equation of Signal -noise (S/N) ratio for the response

S/N = -10log10∑y2/N

The response value is y and the number of experiments is n.

Similarly, SN ratio values can be obtained for other experimental runs in orthogonal array. The Cumulative data for S/N ratio epoxy resins coating Wear are calculated as shown in table 2.

Table 2: L9 Signal to Noise Ratio of Specific Wear Rate

ExperimentsInputs FactorsOutput Responses
Trial No.Reinforcement (%)Load
(N)
Temperature (oC)Wear rate
(mm3/Nm* 10-3)
S/N Ratio
125454.001-12.0434
2210503.496-10.8714
3215553.746-11.4714
445503.985-12.0086
5410554.117-12.2916
6415453.882-11.7811
765554.213-12.4918
8610453.887-11.7923
9615503.394-10.6142

.

Finding the values of the SN ratio is done with the assistance of the Minitab 19 software. Experiment after experiment demonstrates that the SN ratio is very stable across the board.

B. Main Effects of Wear Rate

Graph 1 shows the epoxy resin powder with TiO2 S/N ratio Main Effect plot. The maximum SN ratio factor level is the best response. The best wear rate parameters were 2% TiO2 (level 1), 15N (level 3), load, and 50oC temperature (level 2).


asejar_147_03.JPG
Graph 1:
Main Effects Plot for SN Ratio

C. Analysis of Variance

The results of an ANOVA test to determine the significance of the operational parameters (temperature, load, and reinforcement) on the wear rate of an epoxy resin coating. ANOVA measures the fit of several variables. Results were discovered with a 95% confidence level or P values below 0.05. It also indicates how much each aspect contributed and changed, revealing which factor had the most impact.

The total DOF is N-1.

Residual errors degree of freedom:

(fLN)=DF (Sum of DF of all the terms included in the model)

This study uses a three-level, four-parameter L9 array. This study selected four process parameters: load, sliding distance, temperature, and reinforcement.

N-1 = 9-1 = 8 fLN degrees

Three levels give each parameter two degrees of freedom.

8-(2+2+2+2) = 0.

ANOVA divides the SS (sum of squares) by degrees of freedom to produce the adjusted mean square. Residual error has no degrees of freedom, hence its mean square cannot be calculated.

Table 3: ANOVA Results

SourceDFAdj SSAdj MSF-ValueP-Value% Contribution
Reinforcement20.0946870.04734346.810.02116.04
Load20.2336020.116801115.480.00939.59
Temperature20.2596740.129837128.370.00844.01
Error20.0020230.001011
Total80.589985

The following is an explanation of the ANOVA table:

  • DF: The degrees of freedom for each factor are shown in the DF column. The number of independent values in a collection of data is measured by degrees of freedom.
  • Adj SS: The adjusted sum of squares for each element is shown in the Adj SS column. The adjusted sum of squares is a measure of the data variance explained by each element.
  • Adj MS: The adjusted mean square for each factor is shown in the Adj MS column. The adjusted mean square is determined by dividing the adjusted sum of squares by the degrees of freedom for that factor.
  • F-Value:The F-value is a test statistic that is used to compare adjusted mean squares of the different factors.A high F-value indicates that the factor is significant and has a significant effect on dependent variable.
  • P-Value:The P-value is the probability of obtaining an F-value as large or larger than the observed value if the null hypothesis is true.A P-value less than 0.05 is generally considered to be statistically significant.

Table 4: Model Summary

SR-SqR-Sq(adj)
0.031899.66%98.63%

The model has a high adjusted R-squared value (98.63%) and high R-squared value (99.66%), according to the model summary table. This indicates that a significant amount of the data variance can be explained by the model. The residuals' standard deviation, or S value (0.0318), represents the mistake in the model. A low S value indicates that the model has a low error.

All things taken into account, the model summary table indicates that the model fits the data adequately. Its R-squared value is high, along with its adjusted R-squared value and S value.som In general, a good model will have a high R-squared value, a high adjusted R-squared value, and a low S value


The terms in the model summary table are explained in further detail below:

  • R-squared: The model's fit to measure of how well the model fits the data. A higher number on a rangr of 0 to 1 denotes a better fit. A model that exactly fits the data is represented by a value of 1.
  • Adjusted R-squared: This measure accounts for the quantity of independent variables in the model. In cases where there are several independent variables, it provides a more accurate assessment of the model's fit than the R-squared number.
  • S: The S value is the standard deviation of the residuals. It is a gauge for the error of the model. A smaller S number denotes a smaller mistake in the model.

D. Development of Regression Model for Wear Rate

Using expert minitab 19 software a mathematical model for reinforcement, temperature, and frequency is calculated, and regression analysis is performed to obtain the predicted value of wear rate.

  • Collect data: Acquire data regarding the wear rateby a material across different conditions. including load, temperature, and reinforcement. The data need to be gathered methodically, utilising a standardised testing procedure.
  • Identify the independent variables:it is necessary to first identify the independent variables. Wear rate regression models typically include load, temperature, and reinforcement as independent variables.
  • Choose a regression model: Linear regression, polynomial regression, and exponential regression are just a few examples. The relationship between the independent and dependent variables, as well as the data itself, will determine the optimal regression model to use.
  • Estimate the regression parameters: After selecting a regression model, the following action is to estimate the parameters. Numerous statistical techniques, like ordinary least squares, can be used for this.
  • Analyse the regression model: The regression model needs to be evaluated after the regression parameters have been estimated.

    Examining the R-squared value and P-values of the regression coefficients will help achieve this. A high R-squared value means that a significant amount of the data variance can be explained by the model. The regression coefficients are statistically significant if the P-value is less than 0.05.
  • Use the regression model to predict wear rate: The regression model can be used to forecast wear rate in a variety of scenarios after being assessed and determined to be satisfactory.

Regression Equation–

Wear rate=3.66 +0.0209Reinforcement -0.0392Load +0.0102Temperature

Table 4: Predicted and Experimental Values of Wear rate

Sr. No.Experimental valuePredicted valueError %
14.0013.9640.92%
23.4963.8199.24%
33.7463.6741.92%
43.9854.0571.81%
54.1173.9124.98%
63.8823.6146.90%
74.2134.1501.50%
83.8873.8520.90%
93.3943.7079.22%

Wear rate values calculated from each encounter were within 10% of experimental values. Hence the regression equation is valid.. Graph 2 is a picture of the experimental data and the values that were calculated using the regression equation.

asejar_147_04.JPG
Graph 2:
Comparison between Predicted and Experimental value of Wear rate.

E. Confirmation Experiment Result

Compare the value of the wear rate obtained from the confirmation experiment with the value that was predicted by the regression model by looking at the difference in Table 5.


Table 5: Confirmation Experiment Result

ParameterExperimental valueModel valueError %
Specific Wear rate3.3793.6286.86

Keeping the parameters at the best levels suggested by the Taguchi method, a confirmation experiment was done, and the wear rate was compared to whatregressions model predicted maintaining parameters, 6.86 % between the actual and projected results. The experimental and estimated values match.

4. Conclusions

The Taguchi Method were used to investigate the impacts of operating parameters including Reinforcement, Load, and temperature on the optimization of epoxy resins with TiO2. The following conclusions can be made

  • Taguchi's optimal Wear Rate solution is found at Level 1 (2% Reinforcement), Level 3 (15 N Load), and Level 2 (50 °C Temperature),
  • The results of the ANOVA reveal that reinforcement plays a play a crucial part in determining the Wear Rate. The Interaction of the Reinforcement, the Load, and the Temperature contribute 16.04%, 39.59%, and 44.01%, respectively, to the quality characteristic
  • The addition of TiO2 improved the tribological properties, particularly the wear rate. So it has been discovered that TiO2 content reduces wear rate compared to pure epoxy resin.
  • The results of the ANOVA reveal that the contribution of load is greatest for Wear Rate, followed by Reinforcement and temperature. Got value of Wear Rate in the confirmation experiment is lower. Consequently, a high-quality epoxy resin containing MoS2 can be produced by employing the parameter levels suggested by the Taguchi methods.
  • There is less than a 10% difference between the calculated Wear Rate values and the experimental values. So, the model that was made is correct, and The Wear Rate can be computed experimentally for any set of operating conditions within predetermined bounds
  • Addition of TiO2 and Al2O3 reinforcement to epoxy resin significantly improves the mechanical and tribological properties of the polymer coating.
  • The regression model is able to predict the wear rate of the epoxy resin powder coating with a high degree of accuracy.

References

1. Giliopoulos D, Zamboulis A, Giannakoudakis D, Bikiaris D, & Triantafyllidis K. (2020). Polymer/metal organic framework (MOF) nanocomposites for biomedical applications. Molecules, 25, 185.

2. Khatri B, Lappe K, Noetzel D, Pursche K, & Hanemann T. (2018). A 3D-printable polymer-metal soft-magnetic functional composite—Development and characterization. Materials, 11, 189.

3. V. Manubolu, & D. Vanimireddy. (2023). Experimental study on mechanical behaviour of arhar-reinforced composites using GRA with PCA. Int. J. Exp. Res. Rev., 36, 232-243.

4. Seidi F, Jouyandeh M, Taghizadeh M, Taghizadeh A, Vahabi H, & Habibzadeh S, et al. (2020). Metal-organic framework (MOF)/epoxy coatings: A review. Materials, 13, 2881.

5. Lashgari SM, Yari H, Mahdavian M, Ramezanzadeh B, Bahlakeh G, & Ramezanzadeh M. (2021). Application of nanoporous cobalt-based ZIF-67 metal-organic framework (MOF) for construction of an epoxy-composite coating with superior anti-corrosion properties. Corrosion Science, 178, 109099.

6. Deng W, Hou G, Li S, Han J, Zhao X, & Liu X, et al. (2018). A new methodology to prepare ceramic-organic composite coatings with good cavitation erosion resistance. Ultrasonics Sonochemistry, 44, 115-119.

7. A. Jain, C. S. Kumar, & Y. Shrivastava. (2023). An effort for identifying suitable machining range during drilling of a novel al-based composite using electric discharge machine. Int. J. Exp. Res. Rev., 36, 327-346.

8. Deng W, Zhao X, Ren Y, Hao E, Han J, & An Y, et al. (2019). Influence of epoxy resin on the microstructure and cavitation erosion of as-sprayed 8YSZ coating. Ceramics International, 45, 5693-5702.

9. Li M, Li H, Lan JL, Yu Y, Du Z, & Yang X. (2018). Integrative preparation of mesoporous epoxy resin–ceramic composite electrolytes with multilayer structure for dendrite-free lithium metal batteries. Journal of Materials Chemistry A, 6, 19094-19106.


10. Nakonieczny DS, Antonowicz M, & Paszenda Z. (2020). Surface modification methods of ceramic filler in ceramic-carbon fibre composites for bioengineering applications–a systematic review. Reviews on Advanced Materials Science, 59, 586-605.

11. Selim MS, Yang H, Li Y, Wang FQ, Li X, & Huang Y. (2018). Ceramic hyperbranched alkyd/γ-Al2O3 nanorods composite as a surface coating. Progress in Organic Coatings, 120, 217-227.

12. Dal Lago E, Cagnin E, Boaretti C, Roso M, Lorenzetti A, & Modesti M. (2019). Influence of different carbon-based fillers on electrical and mechanical properties of a PC/ABS blend. Polymers, 12, 29.

13. Venkatachalam S, Zeranska‐Chudek K, Zdrojek M, & Hourlier D. (2020). Carbon‐based terahertz absorbers: Materials, applications, and perspectives. Nano Select., 1, 471-490.

14. Singh AK, Panda BP, Mohanty S, Nayak SK, & Gupta MK. (2018). Recent developments on epoxy-based thermally conductive adhesives (TCA): A review. Polymer-Plastics Technology and Engineering, 57, 903-934.

15. Kumar R, Mishra A, Sahoo S, Panda BP, Mohanty S, & Nayak SK. (2019). Epoxy‐based composite adhesives: effect of hybrid fillers on thermal conductivity, rheology, and lap shear strength. Polymers for Advanced Technologies, 30, 1365-1374.

16. M. Saoudi, R. Ajjel, & B. Zaidi. (2017). Recent progress in organic nano-composites: Synthesis and treatments for use as active layers in electronic devices. Int. J. Exp. Res. Rev., 9, 11-46.

17. Bossin L, Bailiff I, & Terry I. (2020). Radiological emergency dosimetry–the use of luminescent mineral fillers in polymer-based fabrics. Radiation Measurements, 134, 106318.

18. Lou M, Chen X, Xu K, Deng Z, Chen L, & Lv J, et al. (2021). Temperature-induced wear transition in ceramic-metal composites. Acta Materialia, 205, 116545.

19. D. M. Patel, & A. H. Gandhi. (2024). Experimental investigation and optimization of forming parameters in single point incremental forming of AZ31 magnesium alloy. IJERR, 46, 240–252.

20. Liu Z, Lei Q, & Xing S. (2019). Mechanical characteristics of wood, ceramic, metal and carbon fiber-based PLA composites fabricated by FDM. Journal of Materials Research and Technology, 8, 3741-3751.

21. Caccia M, Tabandeh-Khorshid M, Itskos G, Strayer A, Caldwell A, & Pidaparti S, et al. (2018). Ceramic–metal composites for heat exchangers in concentrated solar power plants. Nature, 562, 406-409.

22. J. O. Oniore, & P. O. Irikefe. (2025). Environmental degradation channels and economic growth in Nigeria (1990-2023). IJERR, 47, 174–185.

23. Singh A, & Jayswal S. (2021). Mechanical characterization of TiO2 nanoparticles based on glass fiber reinforced polymer composite. in: IOP Conference Series: Materials Science and Engineering, pp. 012006.

24. Khan M, Srivastava S, & Gupta M. (2021). Characterization of TiO2 microparticle-blended polymer-based hybrid wood particulate composites. Mechanics of Composite Materials, 57, 247-256.

25. A. Kumar, R. Kumar, & A. Kumar. (2024). Study of wear rate of AA7050-7.5 B4C-T6 composite and optimization of response parameters using taguchi analysis. Int. J. Exp. Res. Rev., 39, 73-81.

26. Deka BK, & Maji TK. (2011). Effect of TiO2 and nanoclay on the properties of wood polymer nanocomposite. Composites Part A: Applied Science and Manufacturing, 42, 2117-2125.

27. Srivastava S, & Tiwari RK. (2012). Synthesis of epoxy-TiO2 nanocomposites: A study on sliding wear behavior, thermal and mechanical properties. International Journal of Polymeric Materials, 61, 999-1010.

28. S. M. Sundararajan, & M. Mani. (2024). Biodegradable edible microbial cellulose-based film for sustainable packaging from lab to land: Physicomechanical study. Int. J. Exp. Res. Rev., 39, 142-153.

29. Saba N, Tahir PM, & Jawaid M. (2014). A review on potentiality of nano filler/natural fiber filled polymer hybrid composites. Polymers, 6, 2247-2273.


Disclaimer / Publisher's Note: The statements, opinions and data contained in all publications are solely those of the individual author(s) and contributor(s) and not of Journals and/or the editor(s). Journals and/or the editor(s) disclaim responsibility for any injury to people or property resulting from any ideas, methods, instructions or products referred to in the content.