E-ISSN:2583-2468

Research Article

Wear Rate Optimization

Applied Science and Engineering Journal for Advanced Research

2025 Volume 4 Number 3 May
Publisherwww.singhpublication.com

Optimizing Wear Resistance in Composite Materials: Surface Response Methodology

Ingle C1*, Nikalje A2
DOI:10.5281/zenodo.15574061

1* Chandrashekhar Ingle, Research Scholar, Department of Mechanical Engineering, Government Engineering College, Aurangabad, Chhatrapati Sambhajinagar, Maharashtra, India.

2 Aniruddh Nikalje, Associate Professor, Department of Mechanical Engineering, Government Engineering College, Aurangabad, Chhatrapati Sambhajinagar, Maharashtra, India.

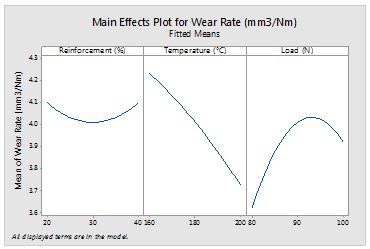
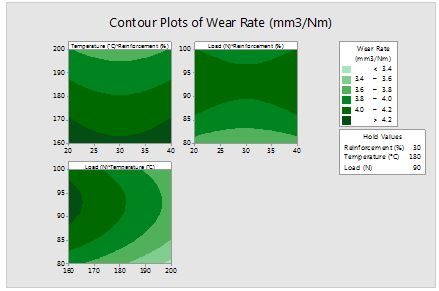
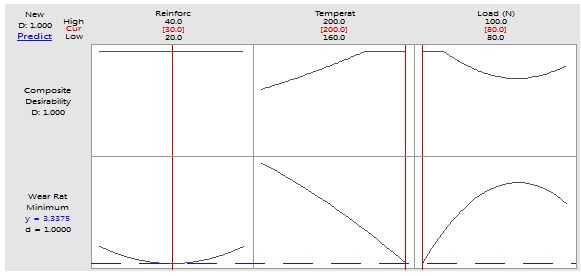
In This research aims to use Response Surface Methodology (RSM) in determining the settings that give the highest wear resistance of the developed (Cu-W) composites by varying reinforcement percentage at 20-40%, temperature at 160-200°C and mechanical load at 80-100N. A regression analysis was carried out to determine the parameters that affect wear rate and indicated that temperature and Cu-W percentage are significant factors affecting the wear rate with p total values 0.017 is significant. Optimization result suggested that at 30% Cu, 200°C and 80N load has the highest desirability of 1.00 with the best wear rate is 3.498 mm3/Nm. Contour and surface plots were used to further elaborate on synergy between the factors. The results of this study will be valuable for creating the adequate Cu-W composites composition that has decent durability in the applications that require the use of electric contacts and tools for high temperatures, in which wear is of great importance. This, therefore, shows how RSM is effective in optimizing the material with minimum experimental runs.

Keywords: tungsten-copper-composites, wear rate optimization, box-behnken design, response surface methodology, design of experiments (doe)

Corresponding Author How to Cite this Article To Browse
Chandrashekhar Ingle, Research Scholar, Department of Mechanical Engineering, Government Engineering College, Aurangabad, Chhatrapati Sambhajinagar, Maharashtra, India.
Email:
Ingle C, Nikalje A, Optimizing Wear Resistance in Composite Materials: Surface Response Methodology. Appl Sci Eng J Adv Res. 2025;4(3):10-17.
Available From
https://asejar.singhpublication.com/index.php/ojs/article/view/146

Manuscript Received Review Round 1 Review Round 2 Review Round 3 Accepted
2025-04-02 2025-04-22 2025-05-12
Conflict of Interest Funding Ethical Approval Plagiarism X-checker Note
None Nil Yes 4.59

© 2025 by Ingle C, Nikalje A and Published by Singh Publication. This is an Open Access article licensed under a Creative Commons Attribution 4.0 International License https://creativecommons.org/licenses/by/4.0/ unported [CC BY 4.0].

Download PDFBack To Article1. Introduction2. Methods and
Methodology
3. Results &
Discussions
4. ConclusionsReferences

1. Introduction

Tungsten-copper (W-Cu) metal matrix composites have found their way to be used in many modern engineering applications mainly because of their properties which are imparted by the resultant phases. The copper matrix was used for its electrical and thermal conductivity, while the tungsten particles were for high strength, stability and wear resistance. These composites are widely used in electrical contacts, heat sinks and high temperature components where factor of both electrical conductivity as well as wear resistance, is of prime importance [2]. The wear resistance is especially important for W-Cu composites to be used in sliding electrical contacts as well as other tribotechnical applications. It has also been confirmed by earlier research works that wear performance of these composites depends on factors such as wt% of tungsten and working temperature and mechanical loading regime [3]. As a result, due to more interrelated nature of these parameters, advanced methods are not helpful in order to predict and improve the wear performance through normal experimentation [4].

This paper discusses the current trends in material design based on the application of systematic design methods for fiber reinforced composites. OFAT is not effective in investigating the second-order interactions between the composition and the service conditions since it does not account for nonlinearities [5]. This has led to increased interest in use of design of experiments (DOE), specifically Response Surface Methodology (RSM) that allows for studies that involves several variables and their interactions [6].

In the present work, the statistical RSM design of Box-Behnken has been used for studying and modeling the wear resistance of the W-Cu composites [7]. The first is the wt% of tungsten reinforcement content (20-40 wt%), which can be seen as the compositional parameter; the second is temperature (160-200°C), which is typical for service conditions; and the final value is the applied load (80-100 N) as a stress parameter. It also provides a systematic approach to the following:

Investigate the extent of response of the wear behavior to the content of tungsten Copper, temperature, and load independently and in combination.

To predict wear rate of materials in engineering applications, the following factors should be put into consideration;

Find out the best suitable composition and working conditions to enhance the wear resistant properties the objective of the present work was to establish structure-property relationships in W-Cu composites.

2. Methods and Methodology

2.1 Optimization Technique

Optimisation strategies are applied to improve new product development, processes and organisational effectiveness. Wear rates can be improved and various approaches can be employed of these, more than one treatment may be employed at a time and results could then be statistically significant giving the garment makers more reliable conclusions and recommendations. Some techniques which are usually applied ion process and product development is Design of Experiment (DOE) [8-13].

2.2 Materials

Copper-tungsten is a bimetal casting element which is widely used due to peculiar properties of tungsten and copper: the high strength and heat stability of the first one in combination with high conductivity of the second one is achieved during powder metallurgy [14]. This form of manufacture usually starts with the compression of tungsten powder into a certain shape or form. Define: Compacted and Sintering The compacted tungsten is caused to undergo a sintering process to heat it up to higher temperatures in order to make the particles to join together and create a porous structure. In the end, molten copper is immersed into the sintered tungsten porous network and the consequent solidification produce Foamed CuW composite system [15].

2.3 Experimental Setup

Table 1 states the specification of the Tribometer setup used in this study. All the experiments were conducted Government engineering College, Aurangabad, and Maharashtra, India.


asejar_146_01.JPG
Figure 1:
Tribometer Setup

Table 1: Specifications of LTR Setup

Make ModelDucom Ltd., Banglore, India
Upper SpecificationPin(dia. × 1)- Φ4×15mm, Φ6×15mm, Φ8×15mm, Φ10×15mm.
Pin Rectangular (l×b×h)-4×6×15
Pin Square (l×b×h)- 4×4×15mm, 6×6×15mm, 8×8×15mm. Ball- Φ10mm
Lower SpecificationRectangular Block (l×b×h)- 40×40×5, 30×30×5, 20×20×5mm
Lower SpecificationEN-31 Steel
Lower Specification Hardness60 HRC
Stroke Length Range10, 20 30 fixed.
Load Range5 to 100 N (In step of 5N)
Temperature RangeAmbient 0oC to 200o C, Ambient 200 to 200o C (For Both Lubrication). Least
count..-0.21oC, Sensor: PT-100
Frequency (Speed) Range11-20Hz(1200rpm) Least count: 1rpm, Sensor, Proximity Sensor
Frictional Force0.1-100N Least Count: 0.1N, Sensor- Piezo Sensor
Wear Measurement Range±2 mm, with least count 1 micron
Water Supply2-5 lpm Provision inbuilt for internal connection. Connect the tap water from
outside while conducting heating test.
Power230 V× 1 Φ×50Hz,8A(For Tester)

3. Results & Discussions

Minitab statistical software has been used for this purpose. Models have been made of the wear rate. ANOVA has been used to find out how each parameter affects wear rate and a linear regression model has been made to predict output model regression model has been made to predict output model [16].

3.1 Analysis of Desirability Values in W-Cu Composite Wear Optimization

The desirability analysis presents valuable suggestions for improving W-Cu composites for wear resistance. This means that the greatest favorability is in the specimen containing 30% tungsten at 200°C temperature and 80N load which shows that this is the ideal ratio of properties. The composites with 30% of tungsten had moderate desirability 1.00 and have the highest desirability. The highest concentration of tungsten results in the relative improvement in wear resistance – while maintaining 30% of tungsten is the most effective in the present work in a range of thermal and mechanical loads. This is in agreement with wear mechanism findings for high-desirability conditions that demonstrate better mixed abrasive-oxidative wear than adhesive wear [17].

Table 2: Optimized Wear Rate Data Table with Desirability and Statistical Significance

ExperimentsInputs FactorsOutput Factors
Trial No.Reinforcement
(%)
Temperature
(°C)
Load
(N)
Wear Rate
(mm3/Nm)
DESIR
Sample 130180903.9500.43485
Sample 2302001003.5490.84967
Sample 320160904.4010.09122
Sample 430160803.7110.61489
Sample 530180904.0250.43485
Sample 620180803.8700.76481
Sample 7301601004.2010.28682
Sample 840180803.5250.76481
Sample 9201801003.7730.43674
Sample 1030200803.4981.00000
Sample 1140160904.3120.09122
Sample 1240200903.7430.65407
Sample 1330180904.0500.43485
Sample 1420200903.8020.65407
Sample 15401801004.2660.43674

3.2 Main Effects of Wear Rate

From Graph 1, the Main Effect plot for the W-Cu composite for wear rate optimally measured response is the level of a factor that has the highest desirability. The optimal wear rateress parameters were 200 °C temperature (level 3), load 80N (level 1) and reinforcement 30% (level 2).


asejar_146_02.JPG
Figure 2:
Main Effects Plot for Wear Rate

The main effects plot shows the endurance of the wear rate of the W-Cu composites as influenced by a singular factor at a time. Found from 20% to 40% enhancement in tungsten reinforcement, the mean wear rate has a good decreasing effect expect of which it signifies that tungsten has a strong influence on wear resistance by hardening effect. Similar to temperature, higher wear rate is obtained at lower temperatures (160°C) and lower wear rate at higher temperature of 200°C, because of improved oxide formation and softening of the copper matrix. At the same time, mechanical load increases gradually to the wear rate and shows that although wear-resistant alloyed with tungsten increases the load-carrying capacity, increasing mechanical stress can contribute to wear damage. This particulate confirms what has been stated in the previous particle, which is that the quantity of Tungsten copper as well as temperature dictate the wear rate but load also has an independent effect with a lower significance than the Tungsten content and the temperature. These can be considered similar to the optimization results and conclude that the highest wear resistance is obtained from the combination of high copper percent (30 %) and elevated temperature (200°C) and reasonable loads to prevent applying mechanical stress. These sight trends are beneficial for the selection of the material and the working state in practical uses of W-Cu composites.

3.3 Analysis of Variance

The analysis of variance shows the significance of the linear terms based on wear rate with the p value <0.05 while the overall model significance is tested and found significant at the level of 0017.

From the above result, it can be seen that the p-value of 0.957 for the lack- of-fit test corroborates that the developed model fits well with the experimental data. Thus, this study has shown that temperature is the most sensitive factor that influences the wear resisting capacity of W-Cu composites with reinforcement content and load also having a firm but lesser impact on the performance of the composites. The results confirm that linear model is suitable to predict wear rate in the mentioned system [18].

Table 3: ANNOVA Result for Wear Rate

SourceDFAdj SSAdj MSF-ValueP-Value
Model60.943160.1571934.970.021
Linear30.692160.2307217.290.011
Reinforcement (%)10.000000.0000000.001.000
Temperature (°C)10.516640.51663616.330.004
Load (N)10.175530.1755285.550.046
Square30.250990.0836652.640.121
Reinforcement (%)*Reinforcement (%)10.028240.0282420.890.372
Temperature (°C)*Temperature (°C)10.003620.0036150.110.744
Load (N)*Load (N)10.207900.2079046.570.033
Error80.253140.031642
Lack-of-Fit60.247720.04128715.240.063
Pure Error20.005420.002708
Total141.19629

3.4 Contour Plot for Wear Rate

By observing these plots, more information could be deduced about the combined effects of the various factors on the wear rate of W-Cu composites [19-23].

asejar_146_03.JPG
Figure 3:
Contour Plot for Wear Rate.


From the non-parallelism of the contour lines, it is possible to pointed out that there are significant interaction effects between the factors that affect the behaviour of these composites and the most important one is the interaction between temperature and reinforcement content, so, while optimising these materials, it is essential to consider not only an individual factor but multiplicity of the factors at the same time.

3.5 Development of Regression Model

Minitab is utilized to create a regression model. By substituting the experimental values of the parameters into the regression equation, wear rate values for all levels of study parameters can be predicted. The correlation between predicted and experimental values wear rate. Using design Minitab software, a mathematical model for reinforcement, temperature and load is calculated and regression analysis is performed to obtain the predicted value of wear rate

Wear Rate=-16.0 -0.0525Reinforcement(%) +0.0155Temperature(°C) +0.442Load(N) +0.000875Reinforcement(%)*Reinforcement(%) -0.000078Temperature(°C)*Temperature(°C)-0.002373Load(N)*Load(N)

Table 4: Experimental and Predicted Values

SetWear Rate (Experimental)Wear Rate (Theoretical)Error (%)
13.9504.0342.08
23.5493.6633.11
34.4014.3421.36
43.7113.8694.08
54.0254.0340.22
63.8703.7363.59
74.2014.1660.84
83.5253.7365.65
93.7734.0336.45
103.4983.365t3.95
114.3124.3420.69
123.7433.8392.50
134.0504.0340.40
143.8023.8390.96
154.2664.0335.78

The difference between the calculated values for wear rate and the experimental values for each experience was found to be less than 10%. We can therefore say that the regression equation that was made is valid.

3.6 Optimization Results Analysis

Table 5: Optimal Solution

ReinforcementTemperatureLoadWear Rate FitComposite Desirability
30200803.4981.00

Analyzing the optimization results compared to the wear rate of 3.498 at the lower bound of the parameters, it is feasible to state that the highest unreinforced wear rate of 3.498 is attained at the outer limits of all the parameters under consideration 30% of reinforcement, 200°C temperature and 80N load with perfect desirability= 1. This implies that wear rate decreases with an increase in all the three factors for the W-Cu comviewsdry composites. The formula contains 30% coppper which offers the right measure of reinforcement strength and the highest temperature that may enhance good surface oxidation and the negative thermal softening impact leading to reduced wear. It is however instructive that the model has estimated the best performance at the maximum load 100N although wear commonly increases with load, this shows that at such high incorporation of tungsten the load-carrying capacity of the composite is a measure more than the wear that might be occasioned by the load. These results indicate well the experimental results, where minimum actual wear rate 3.498 was found under the similar condition of 30%W, 200°C and 80N. This proves that the obtained desirability 1.00 is the global optimum within the range of the tested parameters. However, it needs to be noted that the task might involve sacrificing some of these conditions for such properties as conductivity at least for engineering purposes, since some limits are at the edge of practical realization. The results confirm the tungsten content as being the most critical root cause for wear resistance and detailing how temperature and load can be managed in order to improve on the performance.

asejar_146_04.JPG
Figure 4:
Desirability Plots


3.7 Confirmation Experiment Result

Table 6: Confirmation Experiment Result

ParameterExperimental valuePredicted valueError %
Wear rate3.4983.3374.82

Keeping the parameters at the best levels suggested by the optimization method, a confirmation experiment was done, and the wear rate was compared to what the regression model predicted while keeping the parameters at the same levels. The difference between the actual result and the one that was predicted is 4.82%. This shows that the experimental value and the estimated value are similar.

4. Conclusions

This work provided a promising way to enhance the wear resistance of the W-Cu composites by employing Response Surface Methodology and Box-Behnken Design. The findings summarized as follows are important: The findings summarized as follows are important:

Optimal Wear Resistance Parameters From the result obtained above, 30% reinforcement at 200°C temperature with a load of 80N has the lowest wear rate is 3.498 mm3/Nm at 1.00 desirability.

Therefore results of a statistical analysis in this study showed that of the independant variables used such as temperature, load and the reinforcement percentage, that temperature had the most effect on the wear resistance of the composite than the other two independant variables used. Higher content of copper provides better wear resistance due to the hardening effect, while the higher temperature is probably conducive to creating the oxide layers over the surface, the softening of W-Cu matrix, thus resulting in low wear amount.

A linear regression model constructed in the work allows for achieving a high level of prognosis for the wear rate with the imbalance in the difference between the predicted and experimental values being below 10%.

The optimization analysis also corroborated the above findings to the effect that the maximum wear performance occurs at the extreme ends of the investigated parameters.

Conflicts of Interest

The authors declare no conflicts of interest about the publication of this research paper.

References

1. Nithesh, R., Radhika, N., & Shiam Sunder, S. (2017). Mechanical properties and adhesive scuffing wear behaviour of stir cast Cu-Sn-Ni/Si₃N₄Composites. Journal of Tribology. doi:10.1115/1.4036185.

2. R., Sreenivasa, B. T. Ramesh, Giri, J., Al-Sadoon, M. K., Bongale, A. K., Sathish, T., & Banagar, A. R. (2024). Optimizing process parameters to minimize wear-induced material loss in bronze-based hybrid metal matrix composites using the Taguchi method. AIP Advances, 14, 095104. doi:10.1063/5.0203081.

3. Clinktana, R., Senthil, V., Ramkumar, K. R., Sivasankar, S., & Al-Mufadi, F. A. (2019). Influence of B₄C nanoparticles on mechanical behavior of Silicon brass nanocomposite through mechanical alloying and hot pressing. Ceramics International. doi:10.1016/j.ceramint.2019.06.094.

4. Ahmed, I. M., Nayl, A. A., & Daoud, J. A. (2012). Leaching and recovery of zinc and copper from brass slag by sulfuric acid. Journal of Saudi Chemical Society. doi:10.1016/j.jscs.2012.11.003.

5. Deaquino-Lara, R., Soltani, N., Bahrami, A., Gutiérrez-Castañeda, E., García-Sánchez, E., & Hernández-Rodríguez, M.A. L. (2014). Tribological characterization of Al7075-graphite composites fabricated by mechanical alloying and hot extrusion. Materials and Design, 58, 9-17. doi:10.1016/j.matdes.2014.11.045.

6. Jeon, C. S., Jeong, Y. H., Hong, S. T., Hasan, M. T., Tien, H. N., Hur, S. H., & Kwon, Y. J. (2013). Mechanical properties of graphite/aluminum metal matrix composite joints by friction stir spot welding. Journal of Mechanical Science and Technology, 28(2), 499-504. doi:10.1007/s12206-013-1153-0.

7. Das, Somnath, & Parthadeb Ghosh. (2022). Plant regeneration through somatic embryogenesis of pseudostem callus culture response in in-vitro condition of palmarosa grass (Cymbopogon martinii) with special reference to hardening and pot culture. International Journal of Experimental Research and Review, 25-29. https://doi.org/10.52756/ijerr.2022.v28.004.


8. Parikh, V. K., Patel, V., Pandya, D. P., & Andersson, J. (2023). Current status on manufacturing routes to produce metal matrix composites. Heliyon. doi:10.1016/j.heliyon.2023.e13558.

9. Alam, M. A., Ya, H. H., Ahmad, A., Yusuf, M., Azeem, M., & Masood, F. (2021). Influence of aluminum addition on the mechanical properties of brass/Al composites fabricated by stir casting. Materials Today: Proceedings. doi:10.1016/j.matpr.2021.02.321.

10. Kumar, S., Nandal, A., Kundu, R., & Rakesh, (2020). Study of mechanical properties of rock dust and brass MMC. Journal of Materials Research and Technology. doi:10.1016/j.jmrt.2020.01.045.

11. Zhang, Z., Liu, C. K., Yu, Z. L., & Li, J. Y. (2024). The fabrication of brass reinforced aluminum matrix composites by friction stir welding. Journal of Materials Research and Technology. doi:10.1016/j.jmrt.2024.07.062.

12. Arisgraha, Irene Angela, Nuzulian Akbar Arandana, & Bondan Tiara Sofyan. (2018a). Effects of aluminum addition on the characteristics of Cu-28Zn brass produced by gravity casting. https://doi.org/10.1088/1757-899X/285/1/012031.

13. Aydin Gunes, Ömer Sinan Şahin, Hayrettin Düzcükoğlu, Emin Salur, Abdullah Aslan, Mustafa Kuntoğlu, Khaled Giasin, & Danil Yurievich Pimenov. (2021a). Optimization study on surface roughness and tribological behavior of recycled cast iron reinforced bronze MMCs produced by hot pressing. https://www.mdpi.com/1996- 1944/14/12/3364/pdf.

14. Dusoe, Keith J., Sriram Vijayan, Thomas R. Bissell, Jie Chen, Jack E. Morley, Leopolodo Valencia, Avinash M. Dongare, Mark Aindow, & SeokWoo Lee. (2017). Strong, ductile, and thermally stable cu-based metal-intermetallic nanostructured composites. Scientific Reports. Nature Portfolio. https://doi.org/10.1038/srep40409.

15. Jamwal, Anbesh, Prem Prakash Seth, Devendra Kumar, Rajeev Agrawal, Kishor Kumar Sadasivuni, & Pallav Gupta. (2020). Microstructural, tribological and compression behaviour of copper matrix reinforced with graphite -SiC hybrid  composites. Materials Chemistry and Physics. Elsevier BV. https://doi.org/10.1016/j.matchemphys.2020.123090.

16. Jin-Su Ha, Jae-Hee Hong, Ji-Wook Kim, Sen Han, Chang Kyoung Choi, Hyun Keun Song, Jin-Seok Jang, Dong-Yul Kim, Dae-Cheol Ko, Yi Sangbong, & Yong-Jae Cho. (2023a). The effect of Boron (B) and Copper (Cu) on the microstructure and graphite morphology of spheroidal graphite cast iron. https://www.mdpi.com/1996- 1944/16/12/4225/pdf?version=1686132585.

17. Manvandra Kumar Singh, Rakesh Kumar Gautam, Rajiv Prakash, & Gopal Ji. (2018b). Mechanical and corrosion behaviors of developed copper-based metal matrix composites. https://doi.org/10.1088/1757-899X/330/1/012021.

18. Patel, D. M., & Gandhi, A. H. (2024). Experimental investigation and optimization of forming parameters in single point incremental forming of AZ31 magnesium alloy. International Journal of Experimental Research and Review, 46, 240–252. https://doi.org/10.52756/ijerr.2024.v46.019.

19. Kumar, Arvind, Ranveer Kumar, & Abhishek Kumar. (2024). Study of wear rate of AA7050-7.5 B4C-T6 composite and optimization of response parameters using taguchi analysis. International Journal of Experimental Research and Review 39 (Spl. Volume), 73-81. https://doi.org/10.52756/ijerr.2024.v39spl.005.

20. Nazeer, Faisal, Zhuang Ma, Lihong Gao, Abdul Malik, Sehreish Abrar, Fuchi Wang, & Hezhang Li. (2020). Effect of graphite mesh sizes on thermo-mechanical properties of Cu-GF composites. Vacuum. Elsevier BV. https://doi.org/10.1016/j.vacuum.2020.109989.

21. Raed N. Razooqi. (2023b). Mechanical and physical properties of a hybrid composite with basis of aluminum. https://tjps.tu.edu.iq/index.php/tjps/article/download/780/439.

22. Victor Verbiţchi, Lia Boțilă, Cristian Ciucă, Ana Kostov, Aleksandra Milosavljević, & Radiša Todorović. (2015). Improving a brazed joint structure, with a new ecological brass. https://www.scientific.net/AMR.1111.19.

23. Patel, D. M., & Gandhi, A. H. (2024). Experimental investigation and optimization of forming parameters in single point incremental forming of AZ31 magnesium alloy. International Journal of Experimental Research and Review, 46, 240–252.


24. Yang, Ziyue, Fan Deng, Zhang Tao, Shuai Yan, Heng Ma, Miao Qian, Wei He, Zhifeng Zhang, Yanqiang Liu, & Lidong Wang. (2023). Effects on the microstructure evolution and properties of graphene/copper composite during rolling process. Materials. Multidisciplinary Digital Publishing Institute. https://doi.org/10.3390/ma16165534.

25. Yu, Ting, Fengping Zhong, Fang Zhang, Chenkai Ying, & Guihong Geng. (2021). Application of scanning electron microscopy in metal material detection. Journal of Physics Conference Series. IOP Publishing. https://doi.org/10.1088/1742-6596/2002/1/012010.

26. Zeng, Jun, Jincheng Xu, Hua Wei, Long Xia, Xiaoyan Deng, Sen Wang, & Peng Tao, et al. (2009). Wear performance of the lead free tin bronze matrix composite reinforced by short carbon fibers. Applied Surface Science. Elsevier BV. https://doi.org/10.1016/j.apsusc.2009.02.063.

27. Zhang, Xin, Chen Ma, Shufeng Li, Deng Pan, & Feiyang Zheng. (2020). Interface design of lead-free free- cutting titanium reinforced graphite brass composites and its effect on mechanical properties and cutting performance. Materials Science and Engineering A. Elsevier BV. https://doi.org/10.1016/j.msea.2020.138909.

28. Das, R., Sow, P., Dey, S., & Samadder, A. (2020). A brief overview on role of graphene based material in therapeutic management of inflammatory response signalling cascades. Int. J. Exp. Res. Rev., 21, 25-36. https://doi.org/10.52756/ijerr.2020.v21.004.

29. Patel, Dharmin M, & Anishkumar H Gandhi. (2024). Experimental investigation and optimization of forming parameters in single point incremental forming of AZ31 magnesium alloy. International Journal of Experimental Research and Review, 46, 240-52. https://doi.org/10.52756/ijerr.2024.v46.019.

Disclaimer / Publisher's Note: The statements, opinions and data contained in all publications are solely those of the individual author(s) and contributor(s) and not of Journals and/or the editor(s). Journals and/or the editor(s) disclaim responsibility for any injury to people or property resulting from any ideas, methods, instructions or products referred to in the content.