E-ISSN:2583-2468

Research Article

Regression Analysis

Applied Science and Engineering Journal for Advanced Research

2025 Volume 4 Number 2 March
Publisherwww.singhpublication.com

Experimental and Regression-Based Wear Analysis of MWCNT Reinforced AA7075 Using Box-Behnken Design

Dande K1*, Jawale P2
DOI:10.5281/zenodo.15348294

1* Kiran Dande, M.Tech Student, Department of Mechanical Engineering, Deogiri Institute of Engineering and Management Studies, Chhatrapati Sambhajinagar, Maharashtra, India.

2 Pankaj Jawale, Assistant Professor, Department of Mechanical Engineering, Deogiri Institute of Engineering and Management Studies, Chhatrapati Sambhajinagar, Maharashtra, India.

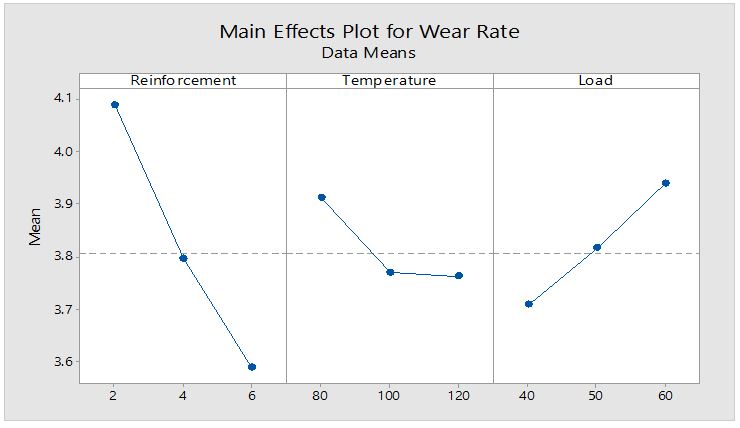
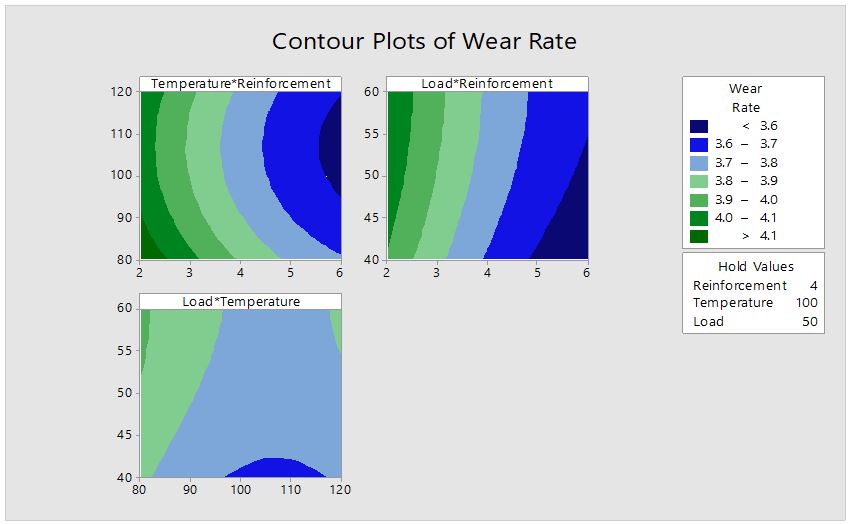
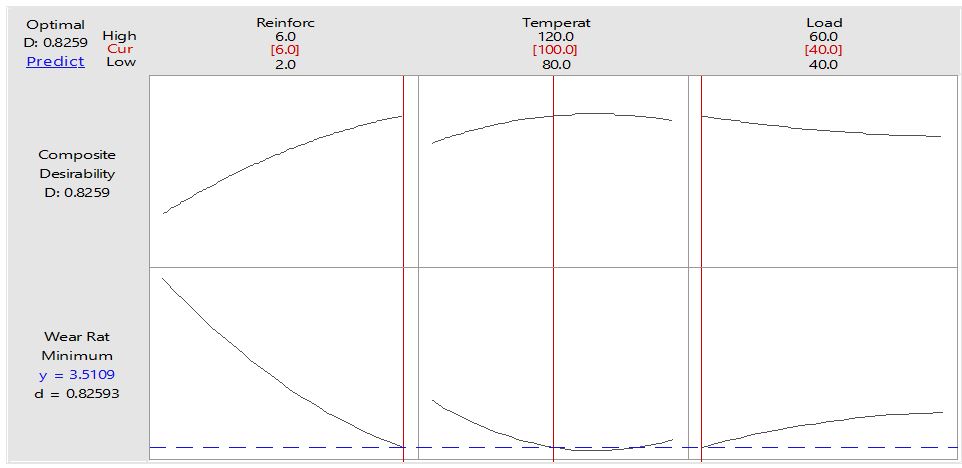
The research analyzes the wear characteristics of MWCNT-reinforced AA7075 metal matrix composites under different combinations of MWCNT volume fraction (2–6 wt%), operating temperature (80–120°C) and applied force (40–60 N). The wear resistance of composites produced by stir-casting fabrication received analysis through ANOVA combined with regression modeling after testing their wear resistance properties. A combination of 6% reinforcement with 100°C temperature under 40 N load proved to be the optimal conditions according to the desirability function approach which led to a wear rate of 3.349 Nm/mm³ and 0.826 in desirability. The studies reveal that reinforcement percentage served as the key variable (p = 0.004) which decreased wear by 25% when using 2% MWCNTs. Performance outcomes were most significantly improved through moderation of temperature conditions at 100°C combined with loading at 40 N. A developed regression model demonstrated the capability to predict wear rates with less than 5% error accuracy following validation through experimental confirmation. The obtained results can directly help engineers build high-wear-resistant composites for industries focused on aerospace and automotive manufacturing.

Keywords: A7075 metal matrix composite, multi-walled carbon nanotubes (MWCNTs), wear rate optimization, response surface methodology, design of experiments (DOE), regression analysis

Corresponding Author How to Cite this Article To Browse
Kiran Dande, M.Tech Student, Department of Mechanical Engineering, Deogiri Institute of Engineering and Management Studies, Chhatrapati Sambhajinagar, Maharashtra, India.
Email:
Dande K, Jawale P, Experimental and Regression-Based Wear Analysis of MWCNT Reinforced AA7075 Using Box-Behnken Design. Appl Sci Eng J Adv Res. 2025;4(2):45-54.
Available From
https://asejar.singhpublication.com/index.php/ojs/article/view/140

Manuscript Received Review Round 1 Review Round 2 Review Round 3 Accepted
2025-02-11 2025-03-01 2025-03-25
Conflict of Interest Funding Ethical Approval Plagiarism X-checker Note
None Nil Yes 4.92

© 2025 by Dande K, Jawale P and Published by Singh Publication. This is an Open Access article licensed under a Creative Commons Attribution 4.0 International License https://creativecommons.org/licenses/by/4.0/ unported [CC BY 4.0].

Download PDFBack To Article1. Introduction2. Materials
and Methods
3. Results
& Discussions
4. ConclusionsReferences

1. Introduction

The performance of engineering materials depends heavily on their ability to resist wear when installed in high-stress environments which include aerospace applications alongside automotive systems and industrial machinery [1].

The market demands strong yet lightweight materials have made aluminum alloys the first choice because they provide high strength and weight reduction benefits alongside corrosion protection [2]. Desirable mechanical properties in Aluminum Alloy 7075 (AA7075) result from its powerful blend of strength resistance and fatigue tolerance which qualifies it for structural load-bearing purposes. Additional modifications are needed to improve AA7075 tribological performance which faces limitations during extreme friction conditions [3].

Scientific research demonstrates that nanoparticles incorporated into MMCs show great potential for addressing this industrial challenge. Technical analyses show that strong nanoparticles act as injectants in aluminum structures to result in substantial material durability and improved wear behavior and better thermal material properties. Scientists choose to study Multi-Walled Carbon Nanotubes (MWCNTs) as reinforcing materials because they show enhanced mechanical performance alongside outstanding thermal qualities and natural lubricating capabilities. When MWCNTs distribute equally throughout aluminum matrices they provide load resistance through reduced material wear during sliding and abrasive situations [4, 5].

Research must focus on optimizing processing parameters while identifying the best material composition for MWCNT-reinforced AA7075 composites. Research about MWCNT weight concentrations has been done yet there is no available optimized study of fundamental tribological features that combines loading conditions and operational temperature analysis with reinforcement volume fraction data. Better predictive models for industrial tribology require deeper investigation of interaction effects that exist between these parameters [6].

A research project has the objective of creating AA7075 composites using different MWCNT weights levels for wear performance assessment [7].

The research uses Response Surface Methodology (RSM) to find the best reinforcement percentage together with temperature and load settings for achieving minimum wear rate. The evaluation of wear behavior utilizes a pin-on-disk tribometer in controlled conditions alongside SEM for analyzing wear mechanisms. The findings will provide valuable insights into the design of advanced wear-resistant composites, bridging the gap between laboratory research and industrial implementation [8].

2. Materials and Methods

2.1. Methodology of Experiment

The development and improvement of designs for products and processes and operations requires a vast number of strategic approaches. To obtain the best possible wear resistance practitioners need to combine multiple approaches because this produces statistical results that enhance the reliability of their final conclusions. Effective analysis of multiple parameter effects occurs through the utilization of Design of Experiments (DOE). Multivariable experiments demand new approaches for experimental design since they create additional experimental combinations based on the growing number of variables. DOE performs assessments of complete factor effects as opposed to single-factor evaluations through its numerical data analysis process [9].

The Box–Behnken design (BBD) represents an efficient three-level Response Surface Methodology (RSM) technique which both reduces experimental trials and presents a solution for dealing with extreme factor space parameters. Standard BBD designs that evaluate three factors at three levels need 15 experimental runs which must include repeated center points for estimating linear and interaction effects and quadratic effects [10-14]. The methodology focuses on optimizing AA7075/MWCNT composites wear rate through systematic factor variation of reinforcement content, normal load and temperature while generating predictive models through ANOVA before validating the optimized condition through confirmation experiments [15, 16]. Selections of level are;

[1] Reinforcement (%): 2 (low), 4 (center), 6 (high)
[2] Temperature (°C): 80 (low), 100 (center), 120 (high)
[3] Load (N): 40 (low), 50 (center), 60 (high)


2.2. Selection of Material

Matrix Alloy: Commercial AA7075 T6 alloy ingots were used as the base material, selected for their high strength and good baseline wear resistance.

Reinforcement: Multi-walled carbon nanotubes (MWCNTs) with 99 % purity, diameters of 5–20 nm, and lengths of approximately 10 µm were procured to enhance hardness and wear resistance.

asejar_140_01.JPG
Figure 1:
MWCNTs nanoparticles

2.3. Experimental Machine Selection

The tribometer that was used in this research is broken down into its component parts in Table 1. The Government Engineering College in Aurangabad, which is located in Maharashtra, India, is where all of the tests were carried out.

asejar_140_02.JPG
Figure 2:
Tribometer Setup

Table 1: Tribometer Specifications

Make ModelDucom Ltd., Banglore, India
Specification (Upper)Pin(dia. 1): 4, 6, 8, and 10 millimetres (15 millimetres).
rectangular pin (lbh)-4, 6, and 15
Pin Square (lbh): 4x4mm, 6x6mm, and 8x8mm.
Ball—10 mm
Lower StandardBlock of Rectangular Shape (lbh): 40x40, 5x30, 5x20 mm
Lower Standard (material)EN 31 Steel
Lower Standard (Hardness)lower standard a 60 HRC hardness
Stroke Length RangeThe stroke length range is fixed at 10-20-30.
Load RangeThe load range is from 5 to 100 N. (In the step of 5N)
Temperature RangeAmbient temperature 200 to 200 degrees Celsius, 200 to 200 degrees Celsius (For Both Lubrication).
Frequency/
Speed Range
1-20Hz Frequency (Speed) Range (1200rpm)
Least count: 1 rpm, Sensor, and Proximity Sensor
Frictional Force0.1-100N Frictional Force
Sensor: Piezo Sensor; Lowest Count: 0.1N
Range of Wear Measurement2 mm, lowest count 1 micron
Water-SupplyWater flow rate: 2–5 lpm There is an internal connection provision built in. while doing heating, connect the outside faucet to the water supply.
Power230V* 1 Φ*50Hz, 8A(For Tester)

2.4. Composite Fabrication

The fabrication process involved stirring melts at the liquid state for composite production. The first production step entailed melting of AA7075 ingots at 750 °C in an inert argon environment for protection against oxidation.

[1] The addition of pre-heat MWCNTs at 200 °C occurred during stirring at 500 rpm for 10 min which helped distribute the particles evenly in the molten alloy.
[2] The produced slurry received a hot steel mold for subsequent cooling in ambient conditions until solidification.
[3] MWCNTs samples consisting of four weight percentage groups containing 2.0, 4.0 and 6.0 wt % MWCNTs were produced through the fabricating process.

3. Results & Discussions

Minitab statistical software has been used for this purpose. Models have been made of the wear rate.


ANOVA has been used to find out how each parameter affects wear rate and a linear regression model has been made to predict output model regression model has been made to predict output model.

3.1. Model Analysis for Wear Rate

A research examines composite material wear rate Nm/mm³ changes by % reinforcement alongside °C temperature and N load to identify minimal wear conditions. The analysis uses desirability functions to convert wear rate results into an output scale between 0 and 1 that shows 1 represents the best outcome (lowest wear rate) and 0 represents the worst outcome (highest wear rate). The technique enables easy assessment alongside multi-parameter system optimization.

Experimental results demonstrate that wear rate exhibits a high responsiveness to the volume of reinforcement material because higher amounts of reinforcement significantly minimize wear. The possession of 6% reinforcement together with 100 °C temperature and 40 N load led Sample 1 to obtain the lowest wear rate of 3.364 Nm/mm³ while holding the highest desirability score at 0.826. A high reinforcement parameter together with a low load condition maximizes wear resistance results according to the experimental data. The combination of low reinforcement with 2% and high temperature at 80 °C and high load at 50 N produced the maximum wear rate of 4.208 Nm/mm³ with the lowest desirability rating at 0.017.

Desirability shows a homogeneous negative pattern with wear rate because an increase in wear rate produces sharp desirability reduction. The wear rate reduction strategy is embedded in the desirability function to provide better outcomes. The use of 2% reinforcement in Sample 5 along with Sample 6 results in poor desirability ratings of 0.26 and 0.15 despite high wear rates exceeding 4.1. When the system runs at 120 °C (Sample 9) the low reinforcement level results in poor desirability while confirming its primary position in system performance.

Temperature alongside load functions as a supporting factor that affects performance at a smaller scale. Sample 2 performs better than Sample 4 at equivalent high temperatures because of its 6% reinforcement level although it carries higher loads.

The data demonstrates that temperature works with performance yet cannot replace adequate reinforcement. High reinforcement together with elevated temperature serves to minimize the negative impact of high load on wear rate.

Overall, the analysis concludes that:

[1] Wear resistance reaches its peak when using material with 6% reinforcement and operating at 100–120 °C temperature with 40 N load.
[2] The decline in desirability becomes significant when wear rate elevates thus making wear rate reduction the main focus for optimization purposes.
[3] The relationship between different variables becomes apparent when viewing the downward-sloping desirability vs. wear rate graphical interpretation that highlights the need for minimum wear for maximum desirability.

Table 2: Desirability analysis of wear rate

ExperimentsInputs FactorsOutput Factors
Trial No.Reinforcement
(%)
Temperature
(°C)
Load
(N)
Wear Rate
(Nm/mm3)
DESIR
Sample 16100403.3640.825927
Sample 26120503.7870.715579
Sample 3280504.2080.016678
Sample 44120403.6040.588048
Sample 52100404.1000.257373
Sample 62100604.1500.140535
Sample 7480403.9900.457701
Sample 84120603.9720.471209
Sample 92120503.9000.147025
Sample 10480603.6980.340862
Sample 114100503.8190.531398
Sample 124100503.7000.531398
Sample 13680503.7540.585233
Sample 146100603.4880.825927
Sample 154100503.5510.715579

3.2. Main Effects of Wear Rate

From Graph 1, the Main Effect plot for the Metal matrix compsosite for wear rate optimally measured response is the level of a factor that has the highest desirability. The optimal wear rate parameters were 80 °C temperature (level 1), load 60N (level 3) and reinforcement 6% (level 3).


asejar_140_graph01.JPG
Graph 1:
Main Effects Plot for Wear Rate

The research explores the impact that reinforcement percentage (%), temperature (°C), and load (N) have on the wear rate (Nm/mm³) of composite materials to achieve minimum wear results. The analysis utilizes desirability functions to convert wear rate outputs into a dimensionless scale between 1 and 0 where 1 represents the desired outcome of low wear rate and 0 stands for undesirable high wear rate. The system enables users to easily evaluate multiple factors alongside each other for optimization purposes.

The experimental findings combined with desirability values demonstrate that wear rate exhibits strong response to reinforcement percentage since higher reinforcement amounts produce substantial wear reduction. The combination of 6% reinforcement with 100 °C temperature while under 40 N load produced Sample 1 which demonstrated the best wear performance reaching 3.364 Nm/mm³ with a desirability rating of 0.826. The optimal condition for wear resistance exists where reinforcement levels are high combined with low loading amounts. Sample 3 (2% reinforcement, 80 °C, 50 N) resulted in the maximum wear rate of 4.208 Nm/mm³ while recording the minimum desirability value of 0.017 because reduced reinforcement levels cause significant performance decline regardless of temperature or load.

Wear rate presents an inverse pattern that connects directly to desirability levels because higher wear rates lead to rapid steep drops in desirability scores. Such results are normal because the desirability function provides higher scores to products with reduced wear rates. The desirability index of Sample 5 and Sample 6 both having 2% reinforcement and exceeding 4.1 mm³/N wear rate falls below 0.26 and 0.15 respectively. Despite operating at high temperatures (such as Sample 9 with 120 °C),

low reinforcement values result in diminished desirable results which demonstrates its controlling position in performance outcomes.

Additional factors of temperature and load affect performance indicators in a less prominent manner. The combination of high temperatures in Samples 2 and 4 leads to different outcomes because Sample 2 contains 6% reinforcement which yields better performance despite having more load. Temperature works as an enhancer for performance while insufficient reinforcement remains an absolute necessity. High load leads to worse wear rates yet high reinforcement and temperature combination will reduce the negative impact of high load.

Overall, the analysis concludes that:

[1] Under these conditions of 6% reinforcement combined with 100–120 °C temperature and 40 N load the wear resistance results in the best outcome.
[2] The decline of desirability becomes rapid when wear rate values increase so optimization initiatives must concentrate on lowering wear rate performance.
[3] The desirability against wear rate curve demonstrates the goal of wear minimization through its downward slope indicating maximum desirability.

3.3. Analysis of Variance

Overall Model Significance: DF (6) and Adj SS (0.6329) tell us the model uses six degrees of freedom (three linear + three quadratic) and explains about 0.633 of the total sum of squares.

The F-value of 3.63 with P = 0.048 indicates that, at the 5% significance level, the model as a whole is significant (since 0.048 < 0.05). In other words, the regression equation explains a statistically significant portion of the variance in wear rate.

Lack-of-Fit Test: Lack-of-Fit (DF = 5) vs. Pure Error (DF = 3) yields F = 2.67, P = 0.224. Since this P-value is well above 0.05, there is no evidence of significant lack of fit, meaning the chosen model form (linear + quadratic) adequately captures the trend in the data without systematic deviation.


Table 3: ANNOVA Result for Wear Rate

SourceDFAdj SSAdj MSF-ValueP-Value
Model60.6328870.1054813.630.048
Linear30.6186640.2062217.110.012
Reinforcement10.4695020.46950216.180.004
Temperature10.0263910.0263910.910.368
Load10.0159030.0159030.550.480
Square30.0363440.0121150.420.745
Reinforcement*Reinforcement10.0123240.0123240.420.533
Temperature*Temperature10.0192540.0192540.660.439
Load*Load10.0014300.0014300.050.830
Error80.2321860.029023
Lack-of-Fit50.1895690.0379142.670.224
Pure Error30.0426160.014205
Total140.865073

3.4. Contour Plots for Wear Rate

The wear rate display through contour plots shows direct visual representations of how wear rate changes according to the controlled interactions among reinforcement (%), temperature (°C), and load (N). The visual maps find their most valuable application in revealing areas where wear rate reaches its lowest point (lower is preferred).

Temperature vs. Reinforcement

[1] As reinforcement increases (from 2% to 6%), the wear rate significantly decreases across all temperature levels. This trend aligns with earlier findings from the ANOVA and main effects plot.
[2] The dark blue region (< 3.6) indicates the lowest wear rate, observed when reinforcement is at 6% and temperature is moderate to high (~100–120°C).
[3] Conversely, at low reinforcement (2%), wear rates remain high (> 4.0) regardless of temperature.

Conclusion: Reinforcement is the dominant factor here, with higher reinforcement effectively reducing wear.

Load vs. Reinforcement

[1] Similar to the first plot, wear rate decreases sharply with increasing reinforcement.
[2] The lowest wear rates (dark blue) are found in the region of high reinforcement (6%) and low-to-moderate load (40–50 N).
[3] As load increases (toward 60 N), the improvement from reinforcement is slightly diminished but still favorable.

Conclusion: Higher reinforcement consistently results in lower wear, even under varying load conditions.

Load vs. Temperature

[1] This plot shows a more complex and less pronounced pattern.
[2] There’s no strong interaction between load and temperature—contours are mostly vertical and parallel, indicating minimal effect of temperature changes at fixed loads.
[3] Slight wear rate improvement is seen at lower temperatures and loads, but the effect is not as significant as with reinforcement.

Conclusion: Load and temperature have a less dominant impact on wear rate compared to reinforcement, supporting the ANOVA results where their P-values were not statistically significant.

asejar_140_graph02.JPG
Graph 2:
Contour Plot for Wear Rate.

Overall Summary

Reinforcement percentage is the most influential factor in minimizing wear rate.

Optimal conditions for lowest wear rate occur at:

[1] High reinforcement (6%).
[2] Moderate-to-high temperature (100–120°C).
[3] Low-to-moderate load (40–50 N).

This contour plot analysis further confirms the findings from the regression model and ANOVA, highlighting that reinforcement addition plays a critical role in enhancing wear resistance of the material system under study.

3.5. Development of Regression Model

Minitab is utilized to create a regression model. By substituting the experimental values of the parameters into the regression equation, wear rate values for all levels of study parameters can be predicted.


The correlation between predicted and experimental values wear rate. Using design Minitab software, a mathematical model for reinforcement, temperature and load is calculated and regression analysis is performed to obtain the predicted value of wear rate.

Regression Equation in Uncoded Units

Wear Rate=5.93 -0.244Reinforcement -0.0416Temperature +0.0261Load+0.0155Reinforcement*Reinforcement +0.000194Temperature*Temperature-0.000212Load*Load

Table 4: Experimental and Predicted Values

SetWear Rate (Experimental)Wear Rate (Theoretical)% Error
13.3643.5094.13
23.7873.6015.17
34.2084.1930.36
43.6043.7082.80
54.1003.9892.78
64.1504.0871.54
73.9903.8204.45
83.9723.8064.36
93.9004.0814.44
103.6983.9185.63
113.8193.7571.65
123.7003.7571.52
133.7543.7131.10
143.4883.5090.60
153.5513.6011.39

The difference between the calculated values for wear rate and the experimental values for each experience was found to be less than 10%. We can therefore say that the regression equation that was made is valid.

3.6. Optimization Plots for Wear Rate Analysis

Table 5: Optimal Solution

ReinforcementTemperatureLoadWear Rate FitComposite Desirability
680603.51091

Composite Desirability and Wear Rate Prediction: The composite desirability plot reveals the best combination of parameters that lead to the minimum wear rate while balancing all process variables. The maximum desirability value achieved is 0.8259, which indicates a highly acceptable solution close to the ideal (1.0). The corresponding predicted minimum wear rate is 3.5109 Nm/mm³, suggesting that the optimized process parameters effectively reduce material loss.

This value falls well below the average wear rates observed experimentally, showing the effectiveness of model-based optimization.

Effect of Reinforcement on Wear Rate and Desirability: Reinforcement is observed to have the most significant influence on wear rate. As the percentage of reinforcement increases from 2% to 6%, the wear rate consistently decreases, indicating enhanced wear resistance. The desirability also increases in this range, with the highest desirability observed at 6% reinforcement. This behavior confirms that higher reinforcement improves the composite's ability to resist wear, likely due to the increased hardness and barrier effect provided by the reinforcing phase. Therefore, reinforcement is the most critical factor in minimizing wear.

Effect of Temperature on Wear Rate and Desirability: The temperature has a non-linear effect on wear rate and desirability. Initially, as temperature increases from 80°C to around 100°C, the wear rate tends to decrease slightly, improving desirability. However, beyond this point, wear rate begins to rise again, indicating an optimal operating temperature. This behavior may be due to thermal softening effects at higher temperatures, which reduce surface hardness and lead to increased wear. The ideal temperature for minimizing wear is found to be 100°C, balancing thermal effects while maintaining material integrity.

Effect of Load on Wear Rate and Desirability: The applied load demonstrates a mild increasing effect on wear rate. As the load increases from 40 N to 60 N, there is a gradual rise in wear rate, which slightly decreases desirability. This trend suggests that higher normal forces during sliding contact contribute to increased material removal. However, compared to reinforcement and temperature, load has a relatively lower influence on the outcome. The optimal load value for minimizing wear rate is 40 N, which supports reduced surface stress and better wear performance.

Optimal Parameter Settings for Minimum Wear: The optimized combination of input parameters, derived from the desirability analysis, includes 6% reinforcement, 100°C temperature, and 40 N load. These settings yield the lowest wear rate prediction (3.5109 Nm/mm³) and the highest desirability score (0.8259). The analysis confirms that maximizing reinforcement while keeping the load at a lower level and operating at a moderate


temperature yields the most favorable tribological performance. These optimized conditions can be recommended for applications aiming to enhance the durability and efficiency of composite materials under sliding wear environments.

asejar_140_graph03.JPG
Graph 3: Desirability Plots

3.7. Confirmation Experiment Result

Table 6: Confirmation Experiment Result

ParameterExperimental valuePredicted valueError %
Wear rate3.3493.5104.50

Keeping the parameters at the best levels suggested by the optimization method, a confirmation experiment was done, and the wear rate was compared to what the regression model predicted while keeping the parameters at the same levels. The difference between the actual result and the one that was predicted is 4.50%. This shows that the experimental value and the estimated value are similar.

4. Conclusions

The study on the wear rate of AA7075-MWCNT composites has led to several important conclusions based on the experimental analysis, regression modeling, and optimization of process parameters. The main findings are:

[1] Reinforcement Material's Dominant Role: The amount of MWCNTs present in the composite material has the greatest influence on reducing wear rate values. The wear resistance reaches its peak performance value when the composite contains 6% reinforcement content since this percentage continuously produces decreased wear rates. The reinforcing material produces better toughness and enhances its protective properties.
[2] Temperature and Load Effects: The amount of reinforcement content demonstrates stronger influence than temperature changes or applied load on the wear rate of cement materials.

The wear resistance of this material demonstrates a non-linear relationship to temperature between 100°C and its maximum effective range for resistance. The wear rate develops upward pressure when temperatures rise above this particular threshold owing to thermal softening. Load increases wear rate moderately and steadily as a result of which 40 N stands as the most effective value for reducing wear.
[3] Optimization of Wear Rate: To minimize wear rate the best parameters included 6% chopped ASR addition at a temperature of 100°C under a 40 N load. The combined use of high reinforcement percentage with medium operating temperature and reduced load produced the lowest wear rate at 3.5109 Nm/mm³ and an optimally desirable combination (0.8259) confirming this as the best performance scenario.
[4] Desirability and Wear Rate Correlation: A clear opposite pattern between the desirability function and wear rate emerged after its transformation from wear rate through a 0 to 1 scale. Desirable outcomes occurred when wear rate levels declined. The desirability analysis served as an effective method to optimize multiple parameters through which researchers could determine precise strategies to reduce wear in composite materials.
[5] Model Validity: The wear rate prediction model obtained validity through measurements of its predicted results against experimental values. The model developed strong predictive accuracy because experimental and predicted values showed an error margin less than 5% on average. The regression model demonstrates it can be used reliably to anticipate wear rate performance across different situations.

Conflicts of Interest

The authors declare no conflicts of interest about the publication of this research paper.

References

1. Suresh, S., Sudhakara, D., & Vinod, B. (2020). Investigation on mechanical, wear, and machining characteristics of Al 7075/MWCNTs using the liquid state method. Advanced Composites and Hybrid Materials, 3, 243-254. https://doi.org/10.1007/s42114-020-00156-2.


2. Jain, A., Kumar, C. S., & Shrivastava, Y. (2023). An effort for identifying suitable machining range during drilling of a novel Al-based composite using electric discharge machine. J. Exp. Res. Rev., 36, 327-346. https://doi.org/10.52756/ijerr.2023.v36.030.

3. Sanju, M., Saravanan, M., Krishna, G., & Kumaran, S. (2020). An investigation of wear behavior on AA7075 MMC reinforced with CNT and fly ash composites. Materials Today: Proceedings, 22, 2460-2468. https://doi.org/10.1016/j.matpr.2020.03.373.

4. Abedalrhman, K. . (2024). Integrative analysis of FinTech innovations in industry: Enhancements and challenges. International Journal of Engineering and Management Research, 14(5), 31–37. https://doi.org/10.5281/zenodo.13937989.

5. Chaturvedi, R., Sharma, A., Sharma, K., & Saraswat, M. (2022). Tribological behaviour of multi-walled carbon nanotubes reinforced AA 7075 nano-composites. Advances in Materials and Processing Technologies, 8, 4743-4755. https://doi.org/10.1080/2374068X.2022.2080330.

6. Saoudi, M., Ajjel, R., & Zaidi, B. (2017). Recent progress in organic nano-composites: Synthesis and treatments for use as active layers in electronic devices. J. Exp. Res. Rev., 9, 11-46. Retrieved from https://qtanalytics.in/journals/index.php/IJERR/article/view/1301.

7. Selvaraj, S., Srinivasan, K., S, R., & Hu, Y. (2020). Sensor-assisted assessment of the tribological behavior patterns of AA7075 hybrid MMC reinforced with multi-wall carbon nanotubes and pulverized fuel ash. Materials, 13. https://doi.org/10.3390/ma13112583.

8. Gecu, R., Yurekturk, Y., Tekoğlu, E., Muhaffel, F., & Karaaslan, A. (2019). Improving wear resistance of 304 stainless steel reinforced AA7075 aluminum matrix composite by micro-arc oxidation. Surface and Coatings Technology. https://doi.org/10.1016/J.SURFCOAT.2019.04.029.

9. Pasha, S., P, R., & P, L. (2017). Wear behavior and Microstructural Characterization of AA7075/MWCNT Surface Composites fabricated through Friction Stir Processing. IOSR Journal of Mechanical and Civil Engineering, 14, 140-146. https://doi.org/10.9790/1684-140305140146.

10. Murugabalaji, V., Rout, M., & Sahoo, B. (2024). Wear behaviour analysis of thermo-mechanically processed AA7075 and AA7075/SiC/Graphite composite. Materials Chemistry and Physics. https://doi.org/10.1016/j.matchemphys.2024.129890.

11. Feijoo, I., Pena, G., Cabeza, M., Cristóbal, M., & Rey, P. (2021). MWCNT-reinforced AA7075 Composites: Effect of reinforcement percentage on mechanical properties. Metals. https://doi.org/10.3390/met11060969.

12. Kaur, N., Singh, K., & Garg, V. (2023). Modelling, sensitivity analysis and optimization of system parameters of edible oil refinery. J. Exp. Res. Rev., 35, 25-33. https://doi.org/10.52756/ijerr.2023.v35spl.003.

13. Chaturvedi, R., Sharma, A., Sharma, K., & Saraswat, M. (2022). Tribological behaviour of multi-walled carbon nanotubes reinforced AA 7075 nano-composites. Advances in Materials and Processing Technologies, 8, 4743 - 4755. https://doi.org/10.1080/2374068X.2022.2080330.

14. Murugabalaji, V., Rout, M., & Sahoo, B. (2024). Wear behaviour analysis of thermo-mechanically processed AA7075 and AA7075/SiC/Graphite composite. Materials Chemistry and Physics. https://doi.org/10.1016/j.matchemphys.2024.129890.

15. Manubolu, V., & Vanimireddy, D. (2023). Experimental study on mechanical behaviour of arhar-reinforced composites using GRA with PCA. J. Exp. Res. Rev., 36, 232-243. https://doi.org/10.52756/ijerr.2023.v36.023.

16. Pawan D. Somavanshi,, & Yogesh U. Sathe. (2025). Exploring the synthesis processes of graphene oxide and silicon dioxide nanospheres: A comprehensive study. Journal of the Textile Association (JTA) 85(4), 1–7.https://doi.org/10.5281/zenodo.14608400.

17. Kumar, J., & Smart, D. (2022). Study on mechanical and wear behaviour of AA7075/TaC/Si3N4/Ti hybrid metal matrix composites. International Journal of Surface Engineering and Interdisciplinary Materials Science. https://doi.org/10.4018/ijseims.2022010105.


18. Kumar, P., & Mashinini, P. (2020). Dry sliding wear behaviour of AA7075 – Al2SiO5 layered nanoparticle material at different temperature condition. Silicon. https://doi.org/10.1007/s12633-020-00728-3.

19. Nikalje, A. M., & Somavanshi, P. (2020). CNC turning parameter optimization for MRR of SS 430 using taguchi methodology. International Research Journal of Engineering and Technology (IRJET), 7(9), 1200.

20. Shikabonga, J., Lungu, K. A., Mwaba, D., Mubita, C., Mulenga, M. N., & Mwanaumo, E. (2025). Sustainable construction: Optimization of microbial soil stabilization for enhanced construction materials. International Journal of Engineering and Management Research, 15(1), 36–52. https://doi.org/10.5281/zenodo.14874393.

21. Dsouza, S., Gowda, M. S., Naik, A. S., Ankolekar, N., & Dsouza, S. W. (2024). Multiple rice leaf disease prediction for MO4 rice leaf variety in dakshina kannada using deep learning technique. International Journal of Engineering and Management Research, 14(6), 68–70. https://doi.org/10.31033/ijemr.14.6.68-70.

22. Naeema Nazar, Aeliswa Raju, Alex Benny, & Ranjeesh R Chandran. (2024). Carbon footprint and sustainability: Assessment and optimization in urban development. International Journal of Engineering and Management Research, 14(5), 38–42. https://doi.org/10.5281/zenodo.13950060.

23. Banerjee, A. (2020). Wavelength dependent photosensitivity modulation of Aluminium/Lead sulphide/Indium tin oxide back-to-back diode. J. Exp. Res. Rev., 22, 1-7. https://doi.org/10.52756/ijerr.2020.v22.001.

24. Pawan D. Somavanshi, & Yogesh U. Sathe. (2023). Evaluating the electrochemical performance of graphite and silicon-based materials in energy storage device. Revista Electronica De Veterinaria, 24(4), 474-479. https://doi.org/10.69980/redvet.v24i4.1277.

25. Biswas, B., Chatterjee, S., & Chabri, S. (2016). Study on the effect of aluminium addition on the physical properties of unsaturated polyester/ jute composites. Int. J. Exp. Res. Rev., 2, 10-13. https://doi.org/10.52756/ijerr.2016.v2.003.

Disclaimer / Publisher's Note: The statements, opinions and data contained in all publications are solely those of the individual author(s) and contributor(s) and not of Journals and/or the editor(s). Journals and/or the editor(s) disclaim responsibility for any injury to people or property resulting from any ideas, methods, instructions or products referred to in the content.