E-ISSN:2583-2468

Research Article

Beef Quality

Applied Science and Engineering Journal for Advanced Research

2025 Volume 4 Number 1 January
Publisherwww.singhpublication.com

Beef Quality Classification and Logistics Patterns over Local, Regional, and National Supply Chains in South Korea

Kim YS1*, Nguyen HN2
DOI:10.5281/zenodo.14835719

1* Yong Seog Kim, Professor, Data Analytics and Information Systems Department, Utah State University, United States of America.

2 Hong Nam Nguyen, Undergraduate Research Assistant, School of Business, Yonsei University, Korea.

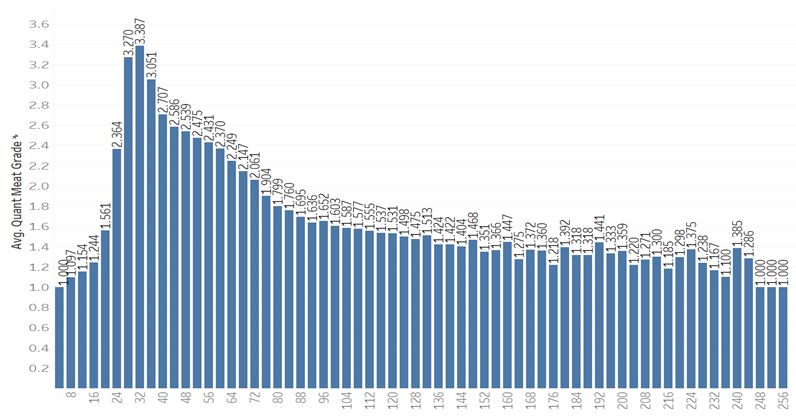
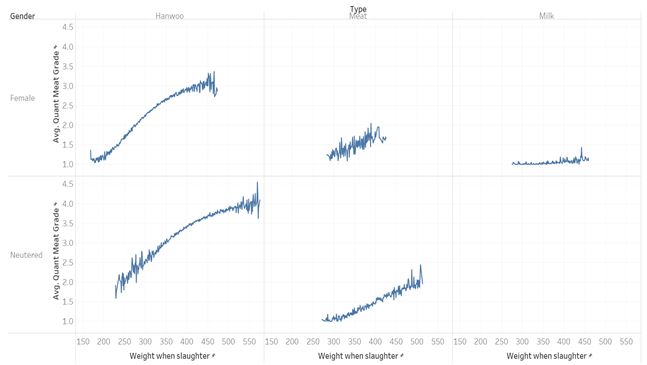
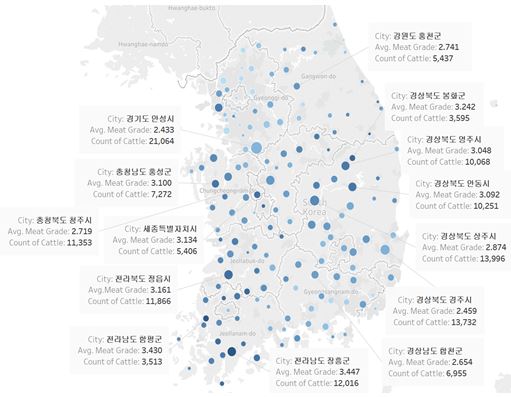
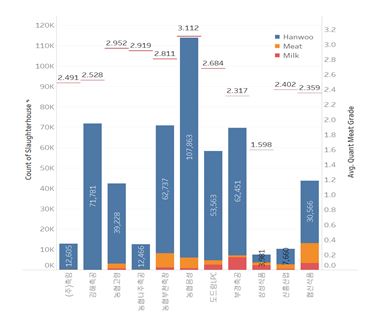
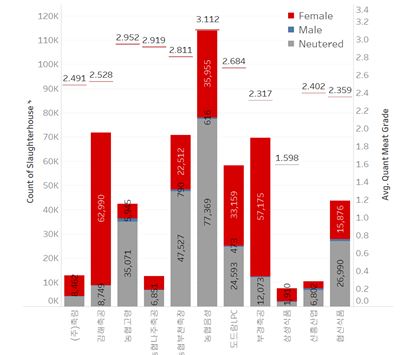
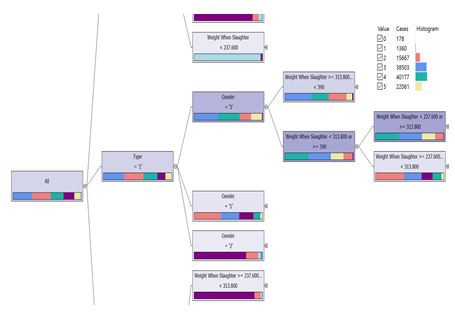
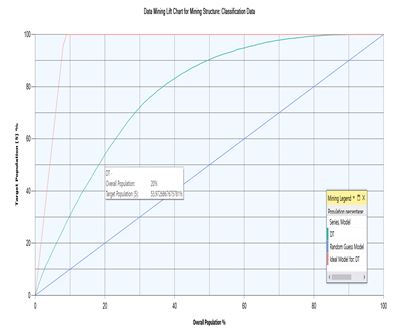
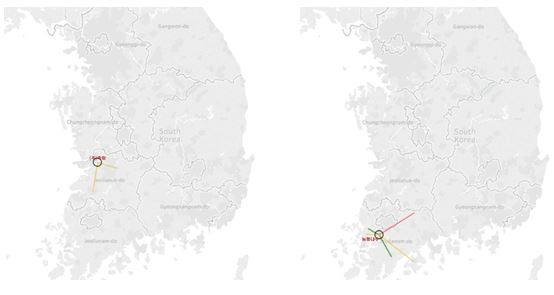
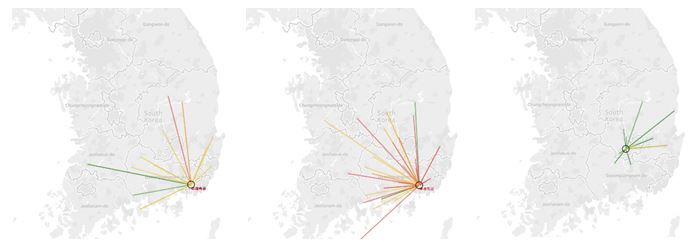
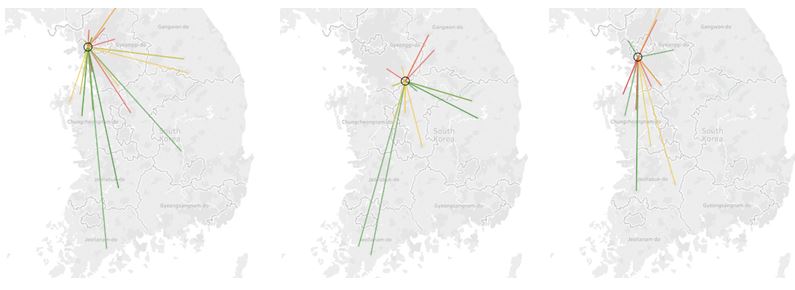
In this paper, we intend to examine the impact of several biological factors such as cattle types, gender, and weights on beef quality using data sets obtained from the digital beef traceability system in South Korea. In addition, we also like to identify several cities or slaughter houses that produce the highest quality of beef to validate whether best places for Hanwoo in our analysis are consistent with cities constantly recommended from Google query and many Koreans. Then we calibrate a machine learning model to identify cattle that are most likely to produce the highest-grade beef. According to our calibrated decision tree (DT) model, neutralized male Hanwoo with a certain weight range is most likely to produce high grade meat and our DT model performs at least twice better than a random model in terms of correctly identifying positive samples when top 20% and 40 % of cattle were chosen for a prediction task. Finally, we like to explore different types of beef supply chains in the current digital traceability system and profile them based on their distinct geographical coverages and beef consumption patterns.

Keywords: machine learning, beef quality, decision tree, classification, supply chain

Corresponding Author How to Cite this Article To Browse
Yong Seog Kim, Professor, Data Analytics and Information Systems Department, Utah State University, United States of America.
Email:
Kim YS, Nguyen HN, Beef Quality Classification and Logistics Patterns over Local, Regional, and National Supply Chains in South Korea. Appl. Sci. Eng. J. Adv. Res.. 2025;4(1):30-40.
Available From
https://asejar.singhpublication.com/index.php/ojs/article/view/124

Manuscript Received Review Round 1 Review Round 2 Review Round 3 Accepted
2024-12-24 2025-01-11 2025-01-27
Conflict of Interest Funding Ethical Approval Plagiarism X-checker Note
None Nil Yes 3.8

© 2025 by Kim YS, Nguyen HN and Published by Singh Publication. This is an Open Access article licensed under a Creative Commons Attribution 4.0 International License https://creativecommons.org/licenses/by/4.0/ unported [CC BY 4.0].

Download PDFBack To Article1. Introduction2. Data Sets3. Problem Statements4. Multi-Factor Analysis
on Meat Grade
5. Beef Quality
Classification Model
6. Local, Regional and
National Supply Chains
7. ConclusionReferences

1. Introduction

Due to the globalization of economy and free trade agreements (FTAs) among countries, all industrial sectors including agricultural products sector cope with unprecedented steep competition due to reduced trade barriers and simplified customs procedures. These globalization trends also present new opportunities by allowing business entities to target a much larger group of consumers beyond geographical boundaries in the globally connected marketplace.Due to the limited information of products from remote regions and even foreign countries, however, consumers in the perishable food sectors such as meat and poultry eager to verify the adulteration and authenticity in real time (Kamruzzaman et al., 2015). To this end, almost all member countries of the Organization for Economic Co-operation and Development (OECD) implement digital traceability systems to ensure food safety and promote transparency throughout agricultural food supply chains. For a comprehensive review of digital traceability systems of OECD countries, the readers are strongly recommended to refer to the study (Charlebois et al., 2024) and cited studies there.

In this paper, we focus on the traceability and transparency in digital food supply chains in South Korea. In particular, we are interested in beef supply chain, tracking the movement of beef from the location of farms and farmers to the location of finished beef. In Korea, the South Korean Ministry of Agriculture, Food and Rural Affairs and the Ministry of Science and ICT started to collect data such as cattle rearing, slaughtering, packing and where is to be sold in January 2019 (Euro Meat News, 2023). In particular, the South Korean authorities intended to collect and store all data automatically through attached Bluetooth devices to the cattle and maintain data integrity by storing all credential information on the blockchain. Ultimately, such digital traceability system of beef supply chain would enable the authorities to detect any beef hygiene and safety issues more quickly and react as soon as possible (Charlebois et al., 2024).

In addition to effort from the South Korean government, several major companies in Korea also collaborated together for the purpose of enhancing food traceability. For instance, the Korea Telecom (KT) and Nongshim Data System (NDS) worked

together to reduce the cost of producers and enhance the convenience of consumers through automated data collection and QR code verification (Charlebois et al., 2024). Such efforts for digital traceability system will greatly benefit groups of people with strict food processing requirements (e.g., for halal food) due to their religious and cultural backgrounds. Fundamentally, such digital traceability system will serve as an authoritative channel that not only encompasses various analytical methods (e.g., sensory, physicochemical, and DNA methods) used to identify food processing and adulteration (Hong et al., 2017) but also provides the transparency and traceability of such information over beef supply chains. In particular, Yang (2022) claimed that the success of the digital food traceability in South Korea can be attributed to its smart city infrastructures along with macro-level of governance and micro-level moral responsibility of citizens.

In this paper, we intend to analyze a large amount of data sets that Korean government generated from its current beef traceability system. By making this data set publicly available, the South Korean government solicits innovative ways of improving its current digital traceability system through findings and insights from many studies by researchers in academics and industries on the provided data sets. Therefore, this study aims to provide any managerial and analytical insights from this data set through a combined approach of exploratory and quantitative analysis. To this end, we first use Tableau software (downloadable from http://tableauyourdata.com/downloads/) to explore and visualize key findings and metrics from the data set. We also use business intelligence modules in MS SQL Server 2022 to calibrate prediction models and estimate their performances.

2. Data Sets

We obtained data sets for our study from a public online site (www.mtrace.go.kr), where Korean government hosts a large data set generated from the animal products traceability system to solicit innovative ways of improving its current system through findings and insights from many studies by researchers in academics and industries on the provided data sets. Ultimately, Korean government intends to share the detailed information of beef meat between farmers and consumers on its supply chain.


For our study, we decided to take only the first batch of data sets over three years to control this preliminary study under manageable size. The finalized data contains a total of 514,020 records along with unique identification number, cattle biological characteristics (Birth Date, Breed Type, and Gender), farm information (Farms Location and Owner), meat processing characteristics (Slaughter House and Date, Months and Weight when Slaughtered), and Meat Grade. We present Table 1 for the detailed list of input variables with data types.

Table 1: List of Variables

VariablesData Types
Unit IDText
Birth DateDate
Breed TypeCategorical: Hanwoo, Meat Cattle, Milk Cow
GenderCategorical: Female, Neutralized, Male
Farms LocationText
Farm OwnerText
Slaughter HouseCategorical: 17 Slaughter Houses
Slaughter DateDate
Months when SlaughteredContinuous
Weight when SlaughteredContinuous
Meat GradeCategorical: Others, 3, 2, 1, 1+, 1++

Few variables warrant further explanation. We first explain three breeds of cattle briefly. In Korea, Hanwoo is a Korean native species of cattle with a brown hair and is most closely related to two taurine breeds, theHolsteinand theJapanese Black, but separate from the breeds of China and Europe (Kim et al., 2010; Lee et al., 2014). With the explosive growth of theSouth Koreaneconomy since 1960s, many researchers have engineered this breed to produce high quality of meat (Lim et al., 2016) and, as a result, its unique meat trait is mostly different from other breed meats in terms of pleasant savory and chewy taste. Therefore, in Korean beef market, Hanwoo meat is most preferred to cheaper imported beef and is considered the highest quality by many Koreans even with its highest price. Further, many Koreans consider Hanwoo meat a cultural icon for a special-day due to its best quality in the world and Hanwoo is most desired ingredient of Korean traditional foods for holiday dishes.

Next, meat (or beef) cattle are cattle raised mainly for meat. In particular, meat from cows who have never produced calves, from hybrids of Hanwoo and foreign species, or cow hydrogen is regarded as beef cattle meat.

Typically, beef cattle meat is considered second best with a decent taste at the first bite but much less taste soon after. Finally, (milk) cow cattle are cattle raised for milk and cow meat are typically produced from cows that produced calves. All these meats are inspected and graded as one of six categories: Others (worst), 3, 2, 1, 1+, and 1++ (best). Note that, in Korea, meats with livestock product classification approval certificate can be traded and transported and the certificate can be obtained within the notification area of ​​the livestock classification available in 147 cities.

3. Problem Statements

In this section, we like to formulate research questions we like to investigate. The first research question we consider in this study is to investigate what biological factors (e.g., age, gender, and breed type of cattle) determine the beef grade. After visualizing the relationships between each biological factor and the beef grade as a preliminary step, we finally measure and confirm the significance of the impact of biological factors on the beef grade through a series of t-test.

The second research question is to investigate which farms in which cities produce the highest or the lowest quality of meat. Answers to this question are particularly important for consumers who are willing to pay a premium price for higher quality of meat. Note that our findings on this research question do not directly endorse the transparency and traceability of the current beef traceability system itself. On the contrary, our analysis assumes that the current beef traceability system provides accurate (traceability) and accessible (transparency) information about the production and distribution of beef including its origin and quality. However, our findings on the second question will be useful to confirm or deny well-known claims among Koreans that beef with special provenance characteristics such as its origin, process, or journey is worthy of a premium price. To find answers to this research question, we will compute and compare the average values of beef grade in cities.

Through the third research question, we intend to identify few distinct logistical relationships between farms and slaughter houses in beef supply chain in Korea. In particular, we like to visualize distinct types of beef supply chains in Korea in terms of their geographical coverages (e.g., local, regional, and national scopes) and average beef quality.


Our findings will provide insights on logistical relationships between farms and slaughter houses across cities, regions, and national boundaries.

Finally, we explore how accurately a machine learning model (e.g., decision tree (DT) classifier) can predict the quality of beef grade given limited information of cattle along with supply chain information. Currently, the South Korean government issues beef quality certificate based on the level of marbling, meat color, fat color, and meat texture determined by trained professionals. Therefore, the proposed prediction model of beef quality will provide supplemental information to government issued certificate that enable consumers to make informed choices by simply referring to the limited information of cattle on the product label.

4. Multi-Factor Analysis on Meat Grade

4.1 Measuring Impact of Biological Factors on Meat Grade

In this section, we intend to consider several biological factors to identify the direction and magnitude of their impact on the meat grade. To this end, we converted the original categorical meat grade (others, 3, 2, 1, 1+, and 1++) to a numerical scoring grade (0, 1, 2, 3, 4, and 5) so that we can compute average values of meat grade for a chosen dimension such as cattle breed or gender. To begin with, we first conducted a preliminary analysis to verify a well-known relationship between cattle breed and meat grade. In our data sets, there are three cattle types (Hanwoo, beef cattle and milk cow), and, among them, Hanwoo occupies the largest portion (90.5%) of data sets followed by beef cattle (6.1%) and milk cow (3.4%). Our data analysis confirms that Hanwoo produces the highest meat grade on followed by beef cattle and milk cow (2.86 vs. 1.45 vs. 0.53) and the difference of meat grade among cattle types is statistically significant (t-test, p < 0.01). We also noted that within the same cattle breed, meat quality values range significantly, implying that there are other factors that affect the meat quality.

The next factor we considered is gender. In our data sets, the proportion of neutralized male, female, and male is 49.1%, 49.9%, and 1%, respectively, and hence the majority of records are from neutralized male and female.

Our simple analysis shows that neutralized male gender is associated with the highest averaged meat grade on average (3.256) followed by female (2.181) and male (1.133). The difference of meat grade among genders is statistically significant (t-test, p < 0.01).

asejar_124_01.JPG
Figure 1:
Relationships between Age and Meat Grade

The next single factor that we considered is age expressed as months of cattle at the time of being slaughtered since their birth. After creating an age bin for each four months up to 256 months, and computing an average value of meat grade for each bin, we graphically present our findings in Figure 1. According to Figure 1, there exists a strong relationship between age and meat grade. For example, age ranges between 28 and 36 months seem to produce the highest quality of meat (between 3.051 and 3.387). Overall, meat grade sharply increases in age bins of between 4 and 28 months, maintains highest quality in age bins of between 28 and 36 months, sharply declines in age bins of between 36 and 88 months, and finally gradually declines and reaches a plateau area after 88 months.

We also found a strong positive linear relationship between weight and meat grade until weight reaches 450kg, while it turns into a sharp negative trend in the range where weight is heavier than 590kg. Therefore, we conclude that the highest quality of meat can be obtained from cattle that weigh between 450kg and 590kg.

Next, we considered multiple factors such as gender, type and weight of cattle at the same time to identify their effect on meat grade and summarized our findings in Figure 2. First, Figure 2 confirms our finding about a linear relationship between weight and meat grade above. For example, we see all positive relationships in all diagrams in Figure 2.


It is true even for milk cow type that is raised mainly for milk, and hence it produces only low grade meat about 1.0. It is much clearer to see a positive relationship between weight and meat grade in meat cattle type in both female and neutralized male gender as long as they are in ranges of similar weights. We did not show the relationships for male gender of all cattle types here mainly because of its minor percentage in terms of records.

asejar_124_02.JPG
Figure 2:
Average Meat grade with Gender, Breed Type, and Weight

It, however, presents slightly different impact patterns of weight on meat grade of Hanwoo. For female Hanwoo, its meat grade improves from 1 to 3.4 as its weight changes from 170kg to 470kg, following a linear relationship in general. Interestingly, its meat grade improves at an increasing rate in the interval of weights less than or equal to 400kg, but then improves at a decreasing rate thereafter. Notably, its meat grade does not improve at all but rather fluctuates significantly after its weight is greater than 450kg. In contrast, we noticed some different patterns from Hanwoo meat from neutralized male. First, the meat grade of neutralized male Hanwoo is superior to that of female Hanwoo (between 1.5 and 4.5 vs. 1.0 and 3.4) partly because neutralized male Hanwoo weighs between 228kg and 575kg and hence has a better chance to fit into an optimal weight range (450kg and 590kg) that produces the highest quality of meat than female Hanwoo that weighs between 168kg and 473kg. In addition, Hanwoo meat from neutralized male is steadily increasing at a decreasing rate as its weight increases without any acceleration and deceleration observed from female Hanwoo.

4.2 Measuring Relationships between Farm Cities and Meat Grade

In this section, we investigate whether there exist significant differences of meat grades from each city. To this end, we present the average meat grades of cities in South Korea in Figure 3 by taking an average of the meat grades of all farms in each city. In Figure 3, we also use a darker color of circles to indicate a higher quality meat and a larger circle to indicate a larger number of cattle from that city. For notation simplicity, we will use x g(rade) and y c(attle) to denote x grade meat and y number of cattle, respectively. We easily identify several cities associated with large number of cattle and high meat grade from Figure 3. For example, we identify several cities that raise larger number of cattle such as Ansung (21,064 c) and Chongju (11,353 c) in the mid-west region, Hampeyong (11.866 c) and Jeongeub (12,016 c) in the south-west region, and Gyeongju (13,732 c), Sangju (13,996 c), Andong (10,251 c), and Youngju (10,068 c). While the largest number of cattle slaughtered is reported from Ansung (21,064 c) that is relatively closer to Seoul, most of these cities are geographically located in Jeolla (i.e., south-west) and Gyeongsang (i.e., south-east) province, which is far away from Seoul and other metropolitan cities. We also identify several cities that produce high quality of meat such as Jangheung (3.447 g), Hampeyong (3.430 g) and Jeongeub (3.161 g) in the south-west region, Andong (3.092 g), Bongwha (3.242 g) and Youngju (3.048 g) in the south-east region, and Hongseung (3.100 g) and Sejong (3.134 g) in the mid-west region. Considering both number of cattle (>= 10,000 c) and meat grade criteria (>= 3.0 g) that are subjectively determined, we identify Jangheung, Jeongeub, Andong and Youngju as exemplar cities that produce not only high quality meat but also large number of cattle.

asejar_124_03.JPG
Figure 3:
Average Meat Grade and Number of Cattle in Each City


One notable finding we like to address is a possible conflict between findings from our analysis and commonly accepted fact about the best places to taste the best quality of meat in Korea. For example, it is well known that Hongchun (5,437 c and 2.741 g) and Hoengseong (1,314 c and 1.888 g; it is not shown explicitly in Figure 3 but is located just below Hongchun city) in the north-east region (i.e., Gangwon province) are one of the best places to taste the best meat in Korea. This finding surprised us because Hoengseong is best known for its Hanwoo cattle and the county began a strategic marketing campaign to brand itself as the origin of the highest quality beef in Korea along with environment well-suited for cattle farming. A simple Google query for “best places for Hanwoo” endorses it by returning these two cities and three other cities such as Jangheung (12,106 c and 3.447 g), Jeongeub (11,866 c and 3.161 g), and Andong (10,251 c and 3.092 g) as query outcomes. However, unlike three other cities, Hongchun and Hoengseong are not validated from our analysis. That is, their average meat grades are much lower than those of other recommended cities based on our analysis and Google query. While this conflict warrants further investigation in future studies, one of few explanations includes the possibility of having biased and limited data sets. In addition, this conflict does not exclude the possibility that few farms in these two cities may produce meat with the highest grade although average meat grade of all farms in these cities is relatively low.

4.3 Identifying Slaughter Houses with High Meat Grade

In this section, we like to identify and visualize (slaughter) houses that tend to produce higher meat grade than in other houses. To this end, we first computed averages of meat grade for each slaughter house by breed types and visualized them in column charts in Figure 4. To simplify charts, we only showed top 11 houses by removing six houses that process less than or equal to 1,000 cattle. In these figures, left and right y-axis represents the number of cattle processed and the average meat grade from each house. In particular, in Figure 4, the data label in the column chart segment with blue color represents the number of Hanwoo processed in each house, while numbers of other breed types are not shown to simplify the chart.

asejar_124_04.JPG
Figure 4:
Processed Cattles and Meat Quality by Breed Types in Slaughter Houses

From Figure 4, we observed that the 6th slaughter house (“농협음성”) from the left side on x-axis not only processes the largest number of cattle (113,324 c) but also records the highest average meat grade (3.112 g). At first, we try to attribute this finding to the possible difference in the number of breed types in houses. Note that since Hanwoo breed produces superior quality of meat to other breeds, if the 6th slaughter house process significantly more Hanwoo breed than other houses, this may be an answer. However, our chart in Figure 4 does not support our reasoning because while there are at least three houses (the 1st, 2nd, and 4th houses) processes higher proportion of Hanwoo than in the 6th house, their meat grades (between 2.491 g and 2.919 g) are much lower than that of the 6th (3.112 g). However, it is possible that its meat grade is higher than other remaining houses because of the higher proportion of Hanwoo than in other houses.

In Figure 5, we present the computed averages of meat grade for each slaug  hter house and visualized them in column charts by gender to attribute findings in Figure 4 to the possible proportional difference of gender in the processed cattle. As in Figure 4, data labels in the column chart segment in red and gray color represent the number of female (red color), neutralized male (gray color), and male (blue color) cattle. While all data labels of neutralized male are shown in Figure 5, those of female and male gender are shown only when they do not interfere with data labels of neutralized male. Note that as we discussed in Figure 2, neutralized male cattle produces higher quality of meat compared with female cattle.


asejar_124_05.JPG
Figure 5:
Processed Cattles and Meat Quality by Gender in Slaughter Houses

According to Figure 5, the 3rd house processes a higher proportion of neutralized male cattle than the 6th house does, its average meat grade is lower than that of the 6th house (2.952 g vs. 3.112 g). In addition, when we compare average meat grades from few houses (i.e., the 5th, 10th, and 11th) that processed a similar proportion of neutralized gender cattle, their meat grade are also lower than that of the 6th house. Considering these observations, we conclude that the reason of high meat grade of the 6th house does not come from imbalanced gender or breed type but from high quality cattle available from farms near this house. Note that the 6th house is located in the mid-west region where two cities Hongseung (3.100 g) and Sejong (3.134 g) that produce high quality meat are located. We also note that other houses (e.g., the 3rd (2.952 g), 4th (2.919 g) and 5th houses (2.8111 g)) with high grade meat are also located nearby cities like Jangheung, Jeongeub, Andong and Youngju.

5. Beef Quality Classification Model

While our main objective of this study is to exam the significance of multiple factors on meat grade and identify and visualize various supply chains between all farms and all slaughters in Korea, we also like to calibrate a machine learning model (e.g., decision tree (DT) to identify cattle that are most likely to produce the highest-grade meat. Note that DT is a non-parametric algorithm adopted by many researchers in computer sciences and engineering because of its white box characteristic,

making it intuitive for researchers to understand its output based on a tree structure to display if-then rules. We calibrated a DT classifier with the default parameter setting of business intelligence module available in the enterprise edition of MS SQL Server 2022. In the calibration process, the data set is divided into a sub-set as a train set (70%) and the remaining sub-set (30%) as a test set.

asejar_124_06.JPG
Figure 6:
Snapshot of a Decision Tree Structure

Due to its complexity of the entire DT structure, we presented in Figure 6 only a partial structure that allows us to understand if-then rules for our prediction task. According to the longest path of decision nodes with a darker background color in Figure 6, neutralized male Hanwoo (i.e., breed type = “1” and gender = “3”) with weight less than or equal to 237.6kg or weight less than or equal 313.8kg is most likely to produce high grade meat (colored in blue, green, or yellow). Note again that the expansion button at the end of the decision node means that there exist follow-up paths of decision nodes and hence the detailed decision rules in regard to weight criteria will be revealed once the expansion button is selected. However, we stop our discussion at this step because it is not our main objective to determine the exact decision rules about the relationship between weight and meat grade. In addition, we successfully demonstrated that a DT classifier recognizes breed type, gender, and weight of cattle as important variables to identify cattle that are likely to produce high grade meat.

Afore-mentioned DT classifier was calibrated on a train set, and hence it is necessary to test its actual predictive performance on a test set. To this end, we applied the calibrated DT classifier to a test set, and constructed a lift chart that shows sensitivity (or true positive rate or hit rate) on y-axis for a corresponding x-axis value,


representing top x% of population based on the estimated probability of being cattle with the highest-grade meat. By definition, a lift chart for a random model is always a diagonal line because it will statistically correctly identify x% of positive records (= meat records with highest-grade) when top x% of population are classified. The lift chart of an imaginary ideal model will correctly identify all positive records using only the per cent of positive records in the population. We presented the lift charts in Figure 7.

asejar_124_07.JPG
Figure 7:
Lift Charts of DT, Random, and Ideal Model

In Figure 7, a green line represents the lift chart of DT model while a red and a blue line represents the lift chart of an ideal and a random model, respectively. According to Figure 7, an ideal model required about 9% of samples to identify all positive samples and hence when top 20% of cattle are chosen for a prediction task, it identified 100% of positive samples. In contrast, a random model identified only 20% of positive samples when top 20% of cattle were chosen for a prediction task. In Figure 7, our DT model identified 54% of all positive samples, showing its performance between a random model and an ideal model. Based on this observation, the lift (or improvement) of DT over a random model is calculated as 54%/20% = 2.70, meaning that DT model performs 2.7 times better than a random model in terms of correctly identifying positive samples when top 20% of cattle were chosen for a prediction task. Similarly, when top 40% of cattle were chosen for a prediction task, the lift (or improvement) of DT over a random model is calculated as 83%/40% = 2.07.

Overall, DT classifier using breed type, gender, and weight of cattle as predictive variables performs significantly better than a random model.

6. Local, Regional and National Supply Chains

In this section, we identify and visualize characteristics of supply chains between farms and slaughter houses in Korea. Since it is not practical to identify and visualize all the chains between all farms and all slaughters in all provinces, we limited our attention to only few large slaughter houses that have connections with at least 300 farms. We found largely two distinct types of supply chains in terms of geographical coverage. The first type of supply chain is named as a local supply chain of beef meat mainly because this kind of supply chain mainly links local farms to a slaughter in the same host province. The second type of supply chain is named as a national supply chain due to the fact that it connects farms in multiple remote provinces to a slaughter house. Finally, the third type of supply chains, regional supply chains, reflects the connection between farms in neighboring provinces to a slaughter house.

6.1 Local Supply Chains

In this section, we tried and constructed supply chains in Jeolla province, the southern western region of the Korean peninsula. Since Jeolla province consists of two sub-provinces, Jeollabuk-do and Jeollanam-do province, we presented two supply chains for each sub-province in Figure 8 along with the information of average quality of meat using different colors: high quality (> 3) in red line, average quality (between 2 and 3) in yellow lines, and low quality (<=2) in red lines.

asejar_124_08.JPG
Figure 8:
Local Supply Chains in Jeolla Province


We first noted that the supply chains in Jeollabuk-do province (left in Figure 8) are confined within its own geographical boundary. In addition, all supply chains in Jeollabuk-do province are associated with average quality of meat (i.e., between 2 and 3 denoted as yellow line). Based on these observations, we concluded that the meat quality produced in Jeollabuk-do province is an average level and it is most likely consumed within its province.

In contrast, supply chains in Jeollanam-do province (right in Figure 8) show all three levels of meat grades from high quality in red line, average quality in yellow lines, and low quality in red lines. In addition, logistical distances of these supply chains seem to be slightly longer than those in Jeollabuk-do province. However, supply chains in both Jeollabuk-do and Jeollanam-do are commonly defined as local in a sense that each of their geographical connections between farms and a slaughter house is limited within its own province.

6.2 Regional Supply Chains

We defined regional supply chains as supply chains between farms in neighboring provinces to a slaughter house, and we presented such supply chains from Gyeongsang Province in Figure 9.

asejar_124_09.JPG
Figure 9:
Regional Supply Chains in Gyeongsang Province

We immediately noted that three supply chains shown in Figure 9 are different from those shown in Figure 8 in that these supply chains present connections between farms and slaughter houses across the boundary of Gyeongsang province, the southern eastern region of the Korean peninsula. For example, slaughter houses in the first two supply chains in Figure 9 are located in Gyeongsangnam-do (a southern part of Gyeongsang province) but have established supply chains with many farms in neighboring provinces such as Jeolla (Jeollanam-do & Jeollabuk-do), Chungcheong (the mid-west (Chungcheongnam-do) and mid-east region (Chungcheongbuk-do)),

chains across neighboring provinces are interesting considering the fact that most highways in Korea have been constructed to connect between Seoul and local hub cities in southern provinces and hence they are mainly headed from the North to the South and there exists only one highway between Jeolla and Gyeongsang (i.e., between the West and the East) provinces. Overall, based on geographical coverage, we classify these two supply chains as regional supply chains.

The quality of meat produced along these regional supply chains includes all three levels of meat grades from high to low quality and they seem to be consumed within the province and neighboring provinces. In particular, we noted that a particular supply chain in red color (i.e., high quality meat) at the bottom of the second image in Figure 9 is connected to Jeju province, one of most attractive places for national and foreign tourists. This supply chain implies that a high quality of meat is supplied to restaurants in Jeju province for consumption of tourists.

The slaughter house in the third supply chain in Figure 9 is located in Gyeongsangbuk-do (a northern part of Gyeongsang province) and has established chains with farms mainly in Gyeongsang province, forming a local supply chain. The quality of meat produced along this supply chain is low quality in general and hence it is most likely to be consumed within the province.

6.3 National Supply Chains

From our analysis, we found national supply chains in Chungcheong and Gyeonggi Province. We first presented a national supply chain from Chungcheong and Gyeonggi Province in Figure 10.


asejar_124_10.JPG
Figure 10:
National Supply Chains in Chungcheong Province

This supply chain clearly shows the characteristic of a national supply chain through its connection between associated slaughter house and farms beyond geographical boundary of neighboring provinces. This is somewhat expected in advance because Chungcheong province is the geographical hub of highway traffics in Korea due to its central location. As evidenced in Figure 10, the supply chain of the chosen slaughter house represents beef meat transportation from multiple farms in nationwide regions such as Jeolla, Gyeongsang, Chungcheong, and even Gangwon regions. However, it turns out that the quality of meat along this national supply chain is low quality.

asejar_124_11.JPG
Figure 11:
National Supply Chains in Gyeonggi Province

As shown in Figure 11, all three supply chains in Gyeonggi Province found to be national supply chains, connecting slaughter houses to farms in nationwide. Again, this is mainly because Gyeonggi province is the closest to Seoul, the capital city of the Korea where the largest portion of beef meat is demanded and consumed in both wholesale and retail markets.

7. Conclusion

In this paper, we examined the impact of several biological factors such as cattle types, gender, and weights on beef quality. While our multiple t-tests confirmed that all biological factors significantly impact the beet quality, neutralized male of Hanwoo breed with a weight of less than 450kg are most likely to produce the highest beef quality. We also identified several cities that produce the highest quality of beef. To our surprise, two cities, Hongchun and Hoengseong, were not listed as the best places for Hanwoo in our analysis while they were constantly recommended from Google query. Next, we visualized top 11 slaughter houses that tend to produce high quality of beef among slaughter houses that process more than 1,000 cattle. Finally, we calibrated a DT model to identify cattle that are most likely to produce the highest-grade meat. According to this model, neutralized male Hanwoo with a certain weight range is most likely to produce high grade meat. Our analysis indicated that the calibrated DT model performed at least twice better than a random model in terms of correctly identifying positive samples when top 20% and 40 % of cattle were chosen for a prediction task.

One of most important findings from this study is that there exist three different types of beef supply chains in the current digital traceability system in South Korea. They are divided into three categories (e.g., local, regional, and national beef supply chains) based on their distinct geographical coverages and beef consumption patterns within their supply chains. Typically, while supply chains in both Jeollabuk-do and Jeollanam-do were defined as local because of their short geographical spans within its own province, supply chains in Chungcheong and Gyeonggi Province show the characteristics of national supply chains mainly because they are located at the geographical hub of highway traffics in Korea.

In future, we like to investigate whether the traceability and transparency observed in the current beef traceability system in South Korea provide sufficient information for consumers to decide whether or not a higher quality of beef warrants a premium price. In particular, we will be interesting in finding innovative ways to promote the transparency of beef quality certificate including appropriate product labeling of origin, production processes, safety and beef grade value.


At the same time, we will focus on finding ways of enhancing the traceability systems so that both governmental authorities and businesses track and share information in beef quality certificate with consumers through various online sites.

References

1. Lim, D., Choi, B.H., Cho, Y.M., Chai, H.H., Jang, G.W., Gondro, C., Jeong. Y.H., & Lee, S.H. (2016). Analysis of extended haplotype in Korean cattle (Hanwoo) population. BMB Report, 49(9), 514-519. doi:10.5483/bmbrep.2016.49.9.074.

2. Lee, S.-H., Park, B.-H., Sharma, A., Dang, C.-G., Lee, S.-S., Choi, T.-J., Choy, Y.-H., Kim, H.-C., Jeon, K.-J., Kim, S.-D., Yeon, S.-H., Park, S.-B., & Kang, H.-S. (2014). Hanwoo cattle: Origin, domestication, breeding strategies and genomic selection. Journal of Animal Science and Technology, 56(2). doi:10.1186/2055-0391-56-2.

3. Kim, E.H., Cheong, H.S., Bae, J.S., Chun, J.-Y., Park, T.J., Lee, K.K., Yun, Y.M., & Shin, H.D. (2010). Identification of genetic polymorphisms in bovine mtDNA. Journal of Animal Science, 88(8), 2551-2555. doi:10.2527/jas.2009-2235.

4. Charlebois, S., Latif, N., Ilahi, I., Sarker, B., Music, J., & Vezeau, J. (2024). Digital traceability in agri-food supply chains: A comparative analysis of OECD member countries. Foods, 13(7), 1075. https://doi.org/10.3390/foods13071075.

5. Yang, C. (2022). Digital contact tracing in the pandemic cities: Problematizing the regime of traceability in South Korea. Big Data & Society, 9(1), https://doi.org/10.1177/20539517221089294.

6. Hong, E., Lee, S.Y., Jeong, J.Y., Park, J.M., Kim, B.H., Kwon, K., & Chun, H.S. (2017). Modern analytical methods for the detection of food fraud and adulteration by food category. Journal of the Science of Food and Agriculture, 97(12), 3877–3896. https://doi.org/10.1002/jsfa.8364.

7. Kamruzzaman, M., Makino, Y., & Oshita, S. (2015). Non-invasive analytical technology for the detection of contamination, adulteration, and authenticity of meat, poultry, and fish: A review. Analytica Chimica Acta, 853, 19-29. https://doi.org/10.1016/j.aca.2014.08.043.

8. Euro Meat News. (2023). Retrieved from: https://www.euromeatnews.com/Article-Blockchain-beef-traceability-to-be-launched-in-South-Korea/2240 on January, 2025.

Disclaimer / Publisher's Note: The statements, opinions and data contained in all publications are solely those of the individual author(s) and contributor(s) and not of Journals and/or the editor(s). Journals and/or the editor(s) disclaim responsibility for any injury to people or property resulting from any ideas, methods, instructions or products referred to in the content.