E-ISSN:2583-2468

Research Article

Physico-Chemical

Applied Science and Engineering Journal for Advanced Research

2022 Volume 1 Number 1 January
Publisherwww.singhpublication.com

Anger's Spring Water Underwent a Physico-Chemical Examination

Praphul Chandrashekhar1*
DOI:10.54741/asejar.1.1.2

1* Praphul Chandrashekhar, Research Scholar, Department of Chemistry, Chaudhary Charan Singh University, Meerut, Uttar Pradesh, India.

Water quality is a necessary parameter to be study when the overarching goal is to achieve long-term development humanity since the focal point it has directly related to human well-being. The present study conducted to assess the spring water quality in Anger Gutie Town East Wollega, Oromia, Ethiopia. The samples were examined for six parameters physico–chemical Temperature, pH, and total dissolved solids are all factors to consider. Total Suspended Solid, Electrical conductivity, Turbidity), for eleven major chemical parameters (Al3+,Cr+6,Cu, Mn, Fe,K+,SO42‾, PO43‾, NO2‾–N, F‾, Cl‾), and four other physico–chemical parameters (SiO2, NH3–N, Total hardness, and Dissolved oxygen) using standard methods. The parameters in seas that were investigated currently recommended guidelines were below for the quality of drinking and irrigation water

Keywords: physic chemical, supplies and procedure, spring water underwent, tools

Corresponding Author How to Cite this Article To Browse
Praphul Chandrashekhar, Research Scholar, Department of Chemistry, Chaudhary Charan Singh University, Meerut, Uttar Pradesh, India.
Email:
Praphul Chandrashekhar, Anger's Spring Water Underwent a Physico-Chemical Examination. Appl. Sci. Eng. J. Adv. Res.. 2022;1(1):7-13.
Available From
https://asejar.singhpublication.com/index.php/ojs/article/view/3

Manuscript Received Review Round 1 Review Round 2 Review Round 3 Accepted
2021-12-23 2022-01-20 2022-01-22
Conflict of Interest Funding Ethical Approval Plagiarism X-checker Note
None Nil Nil 11.11

© 2022by Praphul Chandrashekharand Published by Singh Publication. This is an Open Access article licensed under a Creative Commons Attribution 4.0 International License https://creativecommons.org/licenses/by/4.0/ unported [CC BY 4.0].

INTRODUCTION

Water is an essential component of resources required by all life forms; it is a universal solvent of organic or inorganic compounds. Human-drinking water must be free of contaminants or/and pollutants, which include toxic elements, chemical compounds and microorganisms. Natural water from rivers, springs and underground resource are polluted by inclusion of a many types of contaminants concluded residential sewage, agricultural runoff, and industrial effluents, are all examples of contaminants and like; this causes changes a series of in environment physico-chemical qualities of water. Spring compared to surface water, water is thought to be cleaner and less polluted. However, spring water is usually exposed to pollution either by natural or anthropogenic causes or by both. Natural causes of spring water pollution Leaching from geologic formations is usually cause. The major sources of anthropogenic pollution include waste dumps by landfills, accidental spills, agricultural runoff, septic tanks, and like. These waste materials introduce harmful pathogens, inorganic and toxic organic chemical pollutants. In Ethiopia, for example, is a developing country, spring water is significant source of drinking water. The suitability of spring water for purpose of drinking is determines by quality.

Water quality analysis essential requirement for sustainable development because it is inextricably tied to human well-being. Guidelines are established by (WHO), for safety of water drinking from which national standards of countries could be derived as required. The WHO, of all diseases around 80%` in human beings are caused by water. The study of parameters physico-chemical like pH, electrical conductivity (EC), temperature, turbidity, total suspended solid (TSS), dissolved total solid (TDS), total hardness (TH), and main cations and anions is used to set quality of water. The Anger Gutie town is located in East Wollega Zone, in Oromia region of Ethiopia. Spring main source of drinking water in United States is water. town. The physico-chemical properties of this drinking water have not studied so far for quality check; hence, there is no baseline data for this water resource. Therefore, objective of this study was to analyze selected physico–chemical spring parameters of used water for drinking and domestic purpose in town.

SUPPLIES AND PROCEDURES

The Study Area's Description

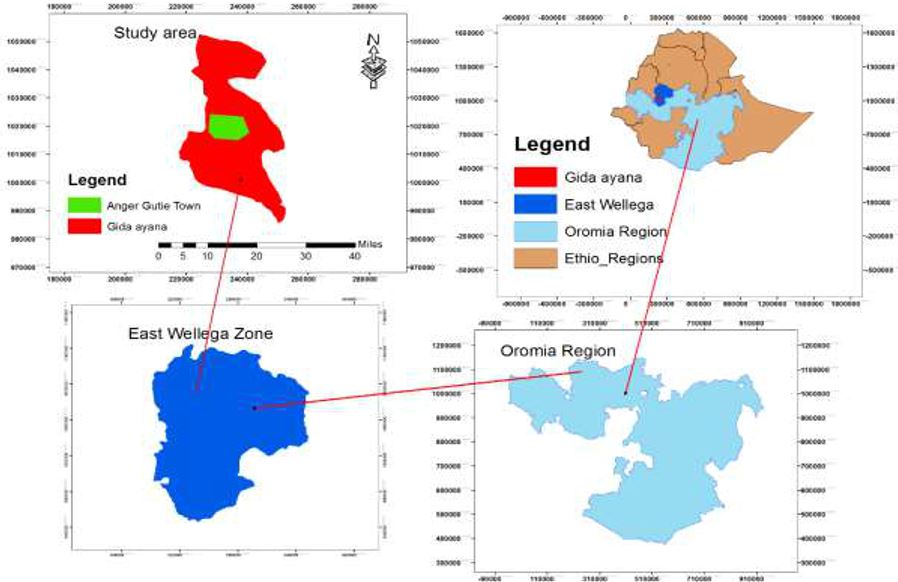
The research area Anger Gutie spring water used for drinking purpose. It is located in East Wollega zone, Western Ethiopia of Oromia Regional State. It is included in Gida Ayana “wereda” and is 70 km far from Nekemte Town (Figure 1). The satellite navigation system locates Anger Gutie, within 9°33'39.32" N 36°37'47.08" E and altitude of 1390 m. The laboratory analyses were conducted within the chemistry the division of Wollega University and Nekemte Town Water Supply and Sewerage Enterprise.
asejar_03_01.jpg

Instruments and Tools

For the purpose of analyzing physico–chemical diverse instruments, such as characteristics of water portable spectrophotometer (Model Dr/2400), portable microprocessor turbidity meter, microprocessor based conductivity/TDS meter (Model1601), DO meter, pen type pH meter (Model 009), Thermometer, Refrigerator, Whatmann filter paper, beakers (different size), volumetric flask (different size), and digital analytical balance were used.

Obtaining Samples and Preservation

The sample of water Anger Gutie drinking spring water have been following collected procedure standard as described by APHA. Using plastic bottle pre-cleaned of one-liter capacity. Prior to sampling, plastic bottles have washed with detergents; HNO3 acid, water taps, then later rinsed, and distilled water with sampled water several times. Containers sample have on the field, relevant codes were used to label the items. The protected spring water samples have collected from four sites of tap water based on the recommended specific guidelines.


Samples had also been collected from (S1 = spring water, S2 = collection chamber, S3 = reservoir, S4 = tanker, residences and hotels). The samples water were stored temporarily in packed ice cooler and transported.

Chemicals and Reagents

Methyl orange  indicator, CaCO3, sodium  hydroxide, anhydrous sodium carbonate, 50% silver sulfate, buffer solution, distilled water, H2SO4, Na2SO4, silver nitrate,  potassium chromate, KCl, EDTA Solution, Ascorbic acid, sulfuric acid reagent calcium and magnesium indicator solution and phosphate reagent. Fresh reagents are used at all times and care great has chemical taken to avoid contamination. All of the compounds that were employed were of extremely great clarity and logical grade.

Examination of a sample

The current research was done in an experimental setting method. The physical parameters conductivity pH, Dissolved oxygen (DO), and Electrical Turbidity, by instruments listed in Total dissolved solids (TDS) Table 1 was been determined.

Table 1: Methods used to determine physico–chemical properties parameter

S/NParametersMethods
1TurbidityNephelometric method
2pHpH Method
3TemperatureTemperature meter
4Dissolved Oxygen (DO)HRDO Method
5Total dissolved solids (TDS)Conductivity/TDS Method
6Electrical conductivity (EC)Conductivity Method
7Aluminum (Al3+)Aluminon Method
8Chromium (Cr6+)1,5-Diphenylcarbohydrazide Method
9Total suspended solids (TSS)Filtration method
10Manganese (Mn)Periodate Oxidation Method
11Iron (Fe)FerroVer® Method
12Copper (Cu)Bicinchoninate Method
13Potassium (K)Tetraphenyl borate Method
14Nitrite-Nitrogen (NO2‾–N)Diazotization Method
15Phosphate (PO43‾)PhosVer® 3 (Ascorbic Acid) Method
16Silica (SiO2)Silicomolybdate Method
17Sulfate (SO42‾)SulfaVer® 4 Method
18HardnessComplexometric titration method
19Fluoride (F‾)SPADNS Method
20Ammonia-Nitrogen (NH3-N)Salicylate Method
21Chlorine, (Cl‾)Argentiometric titration Method

Total suspended solids (TSS) have by determined filtration technique. The other chemical parameters including Chromium (Cr+6), Chloride (Cl‾), Sulphate (SO4‾2), NH3–N, K+, Al+3, Fe, SiO2, Cu, F‾, Mn, NO2‾–N and phosphate (PO43‾) were analyzed using spectrophotometers with their respective reagents as indicated on Table 1. The water Temperature, pH, TDS and Electrical conductivity have analyzed immediately on the spot during the sample collection, whereas the analysis of remaining parameters has done in the laboratory.

RESULTS AND DISCUSSION

The water samples collected from the four sites (S1 = spring water, S2 = collection chamber S3 = reservoir and S4 = distribution sites in residence, certain centers or hotels) in Anger Gutie Town spring water were analyzed for different measurement parameters. A summary of values (Mean± SD) of different physical and chemical factors chosen (n=3) of the protecting spring water samples have been presented in the following sections.

Common Physical Parameters

The results of the studied common physical parameters including Total suspended solid, Total dissolved solid, Electrical conductivity, Turbidity, Temperature, and pH are displayed in Table 2.

Table 2: The averages of common physical parameters in the studied samples water

NoParametersSampling sites
S1 28.16S2 31.23S3 34.83S4 810ESA -WHO 1,500
1EC (µs/cm)
2TDS (mg/L)217270322524.6610001000
3TSS (mg/L)0.331.461.131.06--
4pH5.15.56.26.16.5-8.56.5 - 8.5
5T (°C)25252424-25
6Turbidity (NTU)0.51.84.74.9-5

Electrical Conductivity (EC)

The value of the electrical conductivity of sample from distribution sites (S4, 810µS/cm) significantly differ from the averages of those of spring water (S1, 28.16µS/cm), reservoir (S3, 34.83µS/cm) and collection chamber (S2, 31.23µS/cm) Table 2. Thus, EC values at their lowest and highest points of 28.16 and 810µS/cm has observed respectively.


Differences large have found a correlation between conductivity levels of spring water (S1) and those of distribution sites (S4). High indicates conductivity mineralization high water. The geomorphological context, geological nature of soil formations and depth of the levels captured variables are all that influence conductivity fluctuations. This should attribute to the quality/sanitary status of the tanker (reservoir) at S3 and/or the lines from the tanker to the distribution site (S4). Generally, the value of all water sample of the electrical conductivity is comparable with in ESA and WHO guideline.

Total Suspended Solids (TSS)

The total suspended solid values of the samples water ranged after 0.33 to 1.46 mg/L. Total suspended solid charge taken usually as an index of potential contamination of drinking water. This could result in the spread of many diseases all living things, particularly humans, are affected.

Total Dissolve Solid (TDS)

The electrical conductivity of water samples is related to the amount of oxygen in the water what is the concentration of dissolved minerals, or the total dissolved solids (TDS) is a describe the amount of solid of water samples. The range acceptable of total dissolved solid is less than 1000 mg/L as recommended by ESA and WHO. The range of total dissolved solid of water samples analyzed among 217 to 525 mg/L. The total maximum dissolved solid has practical on the distribution site. This unusual increase of total dissolved solid in the line between the reservoir and distribution sites may indicate that the pipeline with in the locations has some scratch or broken parts allowing leakage of soluble solids in to the water. Therefore, we can conclude that the total dissolved solid of Anger Gutie spring water is within ESA and WHO permissible limit.

Hydrogen Ion Concentration (pH)

All the value of spring water sample is beneath the ESA and range WHO 6.5 to 8.5. This result demonstrates that the pH of the water is alkaline of the acidity of these waterways is a concern pH beneath 7, pH values of 5.1 and 6.2 Table 2 have observed respectively in the spring water and reservoir water sample (S1and S3). Sources of spring water with a pH of less than 6.5 may attributed agriculture and domestic activities contribute to materials this source.

The bedrock of area may not have basic rocks such as carbonate minerals. This may backed up by fact that according to surveys, 98 percent of all spring water related worldwide.

Turbidity

The values turbidity of water samples was found to be of 0.5 and 4.9 NTU (Table 2) respectively in in spring water sample and distribution site water sample (S1 and S4). Samples all water of turbidity was found permissible below bound set by World Health Organization. Water is actually turbidity of optical property expression of in which light is scattered by present particles in water. Silt, organic matter, Clay, and other microscopic organisms Phytoplankton cause turbidity in spring water.

Temperature

In present study temperature varied from 240C–250C. All samples water of temperature has found within bound permissible WHO set by guidelines. The temperature of spring water in this study area is quite high; this should attribute to altitude of region. Important temperature is influence and biological reaction in water parameters factor to physico–chemical. Temperature of chemical reaction higher values accelerates, to reduce dissolved solubility of gases oxygen.

Common Chemical Parameters

The results of studied common metals including Al3+, Cr+6, K+, Cu, Mn, and Fe are displayed in Table 3.
Table 3: The mean values of common metals in studied water samples in mg/L

>
NoParametersSampling sites
S1 0.038S2 *BDLS3 BDLS4 0.002ESA 0.20WHO 0.20
1Al3+
2Cr+60.070.040.110.1-0.05
3Cu0.040.050.060.0821.00
4Mn1.42.510.30.50.40
5Fe0.070.070.430.20.32.00
6K+0.60.50.10.91.5-

Aluminum ion (Al+3)

The maximum value (Table 3) of Aluminum concentration recorded in the spring water sample (0.038 mg/L) and the other collection chamber and reservoir water samples recorded below detection limit.


Ethiopian Standard Agency and World health organization that the recommended concentration 0.2 mg/L exceed. As a result, the concentration detected of aluminum level was within the given acceptable limit of an ESA and World Health Organization guidelines.

Chromium ion (Cr+6)

The acceptable range of Cr+6 is 0.05 mg/L. The variety of Cr+6of the water samples that were examined ranged from 0.04 to 0.11 mg/L Table 3 shows the concentrations. The very best Cr+6 at this place, a value was discovered. of the reservoir. Therefore, it can be concluded that the Cr+6 of Anger Gutie spring water above WHO maximum permissible limit.

Copper (Cu)

The minimum and maximum value of this study area was recorded in the spring water (0.04) and distribution site (0.08) in Table 3. All water samples in this study have Copper quantities below the permissible limit in ESA and WHO guidelines, causes intestinal, and distress stomach, kidney damage and liver, and anemia.

Manganese (Mn)

Manganese is found in abundance in nature spring water in various below concentrations 0.40 mg/L. The amount of Mn, on the other hand, is quite high in “Anger Gutie” spring water was about 2.5 mg/L in collection chamber, 1.4 in spring water sample and 1in reservoir water sample, which is above the recommended value of ESA and WHO. Manganese can be found in over 100 different and distributed water, 0.15 mg/L, stains manganese plumbing laundry fixtures and undesirable causes in beverages tastes. Manganese is an important element inhalation of high concentrations of and animals it has least toxic elements; toxicity in regarded.

Iron (Fe)

The amount of iron samples range in the water from 0.07 to 0.43 as given in Table 3; this data found within WHO guidelines. However, in the reservoir water sample recorded 0.43 above ESA. The importance of iron-rich foods cannot be overstated especially children for reproductive age. The daily recommended consumption is 10mg possible increase in iron (up to 200 mg/L) color are not to be considered harmful.

It found that more because of its abundance in the earth’s crust significant concentration in drinking water.

Potassium ion (K+)

The Potassium ion analyzed concentration of water samples from varied 0.1 to 0.9 mg/L in reservoir and distribution site as shown in Table 3. All the water sample value recorded with in ESA. In water after passing through potassium occurs naturally in certain mineral deposits and rock strata. Potassium is a crucial cation and is extremely important in metabolism in the middle. Potassium is a nutrient that is required for both plant and human life. Excessive doses, on the other hand, can be harmful Humans may suffer as a result of this Common anion composition of the samples water studied includes PO43−, SO42−, F, NO2 and Cl. The resulting data displayed in Table 4.

Table 4: The mean values of common anions in the studied water samples in mg/L

NoParametersSampling sites
S1 0.46S2 1.15S3 1.23S4 4.68ESA -WHO -
1PO4−3
2SO4−23411250500
3F−BDLBDLBDL0.341.51.5
4NO2−–N6.35.76.422.433
5Cl−22.7221.642.624.85250250

Phosphateion (PO43)

Phosphate was used in this investigation the concentration ranged from to 0.46 to 4.68 mg/L (Table 4). Phosphate content at its maximum is 4.68 mg/L detected at the distribution site (S4) while minimum concentration of phosphate observed 0.46 mg/L at the spring water sample (S1). The maximum permissible limit for PO4−3 has not indicated in the ESA and WHO guideline.

Sulphateion (SO42–)

The amount of sulphate in the samples that were examined Samples of water ranged from Table 4 shows the concentrations of 1 to 4 mg/L. All of the samples were well found to be within the acceptable range of ESA and WHO guidelines, found in drinking water do not represent the concentrations normally a risk to health. Sulphur in spring water is normally present in sulphate. It's possible that sulphate will find its way into your body spring water via sulphide-bearing deposits weathering. Sulphate levels must not exceed 250 mg/L.


Nitriteion (NO2)

The mean value for the spring water sample has recorded as 5.7−22.4 (Table 4). It was recorded above ESA and WHO guideline value. Therefore, for domestic and livestock use these sources may not be safe.

Most of the time, nitrates are but their presence is present absent from surface waters, possible in groundwater, mainly in smaller (ammonia) or more oxidized (nitrate) because nitrogen will tend to exist forms.

Chlorideion (Cl)

The maximum Chloride concentration has observed at S3 (reservoir), as shown in Table 4.The chloride content of the water sample has that all found samples concentration showed within the limit permissible.

The analyzed samples, water the chloride varied concentration of from 21.6 to 42.6 mg/L. An anion is chloride found in amount variable in spring water. May chloride also be naturally present in spring water and originate also from sources diverse weathering, sedimentary of leaching rocks and seawater infiltration of etc.

This could be because of the addition of Chloride on the reservoir. It produces salty taste at 250−500g mg/L. The permissible maximum limit of ESA and WHO water potable is 250 mg/L.

Other Physico−Chemical Parameters

The physico−chemical parameters of the water samples studied include total hardness, ammonia, Silica and dissolved oxygen. The resulting data are displayed in Table 5.

Silica (SiO2)

The SiO2 of the analyzed water samples in this study varied from 17.9−32.8 mg/L in Table 5. In the freshwater, silica.

NoParameterSampling sites
S1S2S3S4ESAWHO
1SiO218.432.819.717.9--
2NH3–N0.040.060.060.181.50.5
3TH116.79206.87236.9286.95300400
4DO6.18.76.76.8-4.5–7.5

Table 5: The values of other Physico–Chemical Parameters in the studied samples water in mg/L

The crystalline form of feldspars, amphiboles, silica, but at the silica content is usually higher concentrations less than sodium bicarbonate, pyroxene and mica the silicate minerals are the chief source of silica in spring water. Chloride and sulphate Normal concentrations alkaline waters and in some acidic waters of silica were found in some highly.

Ammonium (NH3N)

Ammonium (NH3−N): The value of impurity of NH3−N in the spring water sample varies from 0.04−0.06 mg/L shown in Table 5. The mean values of all the samples water are within the level permissible of Ethiopian Standard Agency and WHO guideline11 value for safety drinking water (1.5 and 0.5 mg/L). Animal (spreading of wastewater). These great values could be anthropogenic explained and use of animal and fecal pollution originating from livestock breeding.

Total Hardness (TH)

As shown in Table 5. In spring water, bicarbonates, sulphates and chlorides carbonates, of magnesium and calcium mainly contribute to water hardness. The acceptable limit of total hardness is in WHO 400 mg/L and ESA 300 mg/L, study-varied from117 to 287 mg/L as CaCO3.

The collection camber comes under moderate and other three water samples are under very hard water category. The moderate, hard and very hard; 0 to 60 soft water, 6 to 120 water moderate, 121 to 180 hard water, >181 very hard water. Principal toughness causing ions are calcium and magnesium. Water was classified as soft, as per this classification, 25% are moderately hard and 75% are very hard in nature.

Dissolved Oxygen (DO)

The dissolved oxygen values among the spring water mg/L. It was found that in collection chamber (S2) 6.1−8.7 and in spring water sample (S1) contained the highest level 8.7 mg/L contained the lowest 6.1 mg/L as display in Table 5. It is one of the most important parameters.

According to the environmental quality indicate the water purity standard (EQS), prescribed are 6.0 mg/L drinking purpose, 5.0 mg/L for industrial application 4.0−6.0 the following requirements for DO mg/L for fish and livestock.


CONCLUSION

In this study, four different site of spring water sample collected from Anger Gutie Town from East Wollega zone have assessed for the physical and chemical parameters. Such as pH, EC, TDS, TSS, T (0C), Turbidity, Al3+, Cr+6, Cu, Mn, Fe, K+, PO4−3, SO4−2, F, NO2, Cl, SiO2, NH3−N, The experimental data values obtained in the current study are in line with World health organization (WHO) guidelines except for the dissolved oxygen in total hardness and dissolved oxygen of the spring water were measured collection chamber. The ions NO2--N, Mn in (spring water, collection chamber and reservoir) and Cr+6 in (spring water, collection chamber and distribution site) were higher than the permissible levels for safe drinking water set by WHO and pH value was below WHO guidelines. Following this, the drinking spring water at the four locations were potable for drinking after moderate treatment of Mn, NO2-, pH, Cr+6 and dissolved oxygen. Generally, Anger Gutie protecting spring water was suitable for drinking purpose. This study presents baseline data for future reference especially for drinking water assessment in Anger Gutie Town. Studies compare in part of another the spring water this good world physico-chemical intake for property and domestic purpose according to the analysis of the current study.

References

1. Govind P. (2018). Physico-chemical Analysis of Selected Springs Water Samples of Dehradun City, Uttarakh and India. International Journal for Innovative Research in Science & Technology, 2(5), 452-455. [Crossref][PubMed][Google Scholar]

2. Sharma D. (2019). A physico-chemical analysis and management of ground water bodies. Journal of Applicable Chemistry, 3(4), 764-768. [Crossref][PubMed][Google Scholar]

3. Arvind PD. , & Indra PT. (2017). Physico-chemical analysis and mapping of spring water quality. International Journal of Advanced Research in Chemical Science, 4(10), 15-25 [Crossref][PubMed][Google Scholar]

4. Indian Coal and Lignite Resources. (2018). Geological Survey of India. . [Crossref][PubMed][Google Scholar]

5. Akshaya KB, Nirmal KB, Baidhar S, & Swoyam PR. (2020). Assessment of the water quality standard of brahmani river in terms of physico-chemical parameters International Journal of Scientific Research and Management, 2(12), 1765-1772. . [Crossref][PubMed][Google Scholar]

6. Das KC, Arup R, & Rajdeep R. (2018). Physico-chemical analysis of underground water from silchar municipal area of cachar district, Assam, India. International Journal of Engineering Research and Applications, 4(11), 105-108. [Crossref][PubMed][Google Scholar]

7. Dagim AS, Geremew L, Dejene Disasa I, & Tanweer A. (2019). Assessment of physico-chemical quality of borehole and spring water sources supplied to Robe Town, Oromia region, Ethiopia. Applied Water Science, 7,155-164. [Crossref][PubMed][Google Scholar]

8. Faisal BMR, Majumder RK, Uddin MJ, & Halim MA. (2021). Studies on heavy metals in industrial effluent, river and groundwater of Savar industrial area, Bangladesh by principal component analysis, Int. J. Geomat. Geosci., 5(1), 182–189 [Crossref][PubMed][Google Scholar]

9. Patil VT, & Patil PR (2010) Physico-chemical analysis of selected groundwater samples of Amalner Town in Jalgaon District, Maharashtra, India. E. J. Chem. , 7(1), 111–116 [Crossref][PubMed][Google Scholar]

10. Physico-chemical analysis. of drinking water quality of Arbaminch town. Journal of Environmental & Analytical Toxicology. . [Crossref][PubMed][Google Scholar]